Eye Tracking in a Physical Store: A Case Study
For retailers, the physical store is a critical touch point with consumers. Despite this, retailers’ product display strategy remains reactive and is mostly based on past initiatives. Compared to online marketing, point of sale marketing has typically access to less data on customer behavior, especially for behavior other than the actual purchase. New technology such as mobile eye tracking can reduce this lack of objective data.
To illustrate an application of this technology, here is the case study of one of our projects in the retail industry.
Research context
From the beginning, our client was looking to overhaul his product displays. In the displays, you would find multiple products: some were established and generally well known by consumers, others were recently introduced. As is the case for many retailers, some products were more profitable than others. Our research thus had to identify zones in the display that would best feature those more profitable products.
Before contacting us, our client had already produced two new possible product display configurations. We had to assess which of the three configurations (the current and two new configurations) had the best performance.
Research objectives
- Identify zones in the display (and its related products) that most attract consumers’ attention.
- Identify the best configuration among the three alternatives.
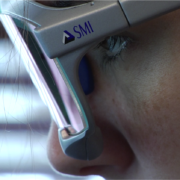
To reach those objectives, we used mobile eye tracking. Since we had to study a real physical display, we chose eye tracking glasses as our tracking device. We recruited sixteen participants whose profile matched our client’s two main targets.
Experimentation
Interviews with each participant lasted for 60 minutes. Each participant had to interact with the three display alternatives in random order. After each interaction, we would have a discussion with the participant to collect his opinions and preferences.
Measures used
- Attention: zones most looked at (total fixation duration)
- Attractivity: most attractive zones (time to first fixation)
- Mutiple measurement scales submitted to participants to assess their display preference based on different criteria.
- Qualitative comments by participants to better understand their thought process when choosing a product in the display.
- Measurement of product recall based on the display configuration.
We combined those measures to get a solid and detailed picture of the consumer. Objective metrics such as attention and attractiveness informed us on the consumer’s real behavior while subjective measures informed us on the “why” of the behavior. Both are needed to produce real improvements to product displays.
Results
By analyzing eye tracking and qualitative data collected during the interviews, we were able to identify the most attractive zones in the displays as well has the most interesting configuration for our client. For example, we saw that for a specific purchase scenario, one of the configurations would catch consumers attention 40% faster and for 29% longer for regular products. We were also able to identify product categories that were the most attractive for consumers. Now, our client has the insights needed to improve and optimize his product displays.
You would also like to improve your product displays’ performance? Contact us to learn more!


