How to Get Clients’ Attention In-Store: Eye Tracking Study at the SAQ
Brandy to add a twist to an eggnog recipe, vodka to create a festive punch, champagne to welcome 2017… We rarely run out of options for Holiday toasts. We recently collaborated with SAQ and OPTECH, a centre for applied research and technology in optics/photonics, to study in-store consumer behavior. We used mobile eye tracking to measure where consumers were looking while shopping at the SAQ to plan a Holiday party. Our objective: find out what grabs clients’ attention in the aisles and how product positioning impact their product choice.
Target Clients and Scenario
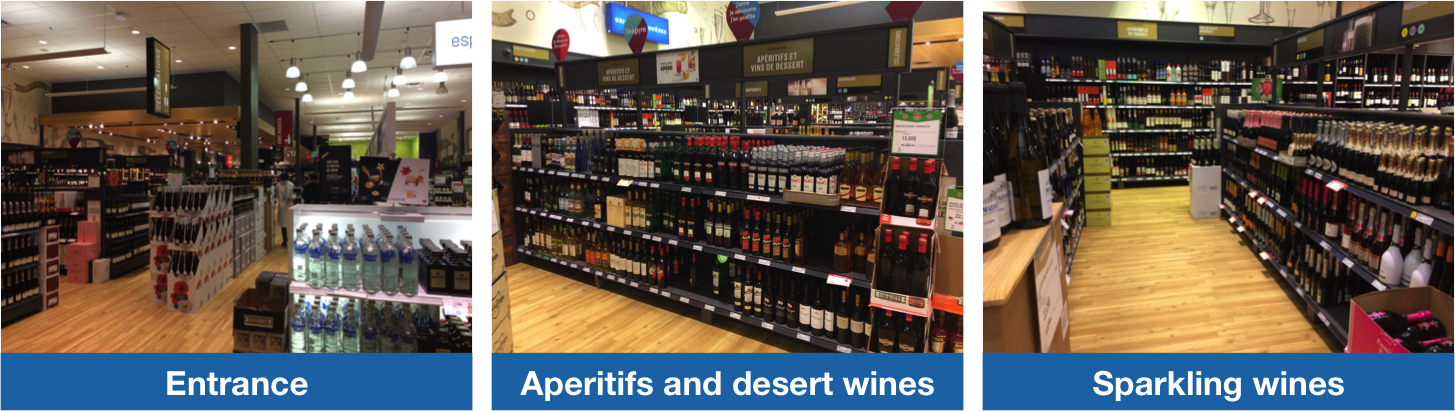
We chose to focus on Millennials. When visiting an SAQ store, these young and connected clients usually buy one or two products to consume the same day. In opposition to wine enthusiasts and connoisseurs, they do not necessarily know what they are looking for when they go in-store. Millennials are especially interesting for our study because they are likely to make purchase decisions based on what grabs their attention. This is why we recruited six SAQ’s clients aged between 21 and 30 years old. All visited an SAQ store every week or month. We asked them to select two specific products (Pineau des Charentes, Prosecco) and two of their choice (aperitif or desert wine, sparkling wine) to create a shopping experience as authentic as possible.
All participants began shopping at the entrance of the SAQ store located next to the Atwater Market. We asked them to close their eyes and explained them their task: buy products for a Holiday party with friends. We provided them a list of products to choose. This scenario allowed us to measure clients’ first impression of the store as well as their gaze path in front of two sections: aperitifs and desert wines, and sparkling wines.
Technology
We have been using fixed eye trackers to measure users’ gaze path on Web and mobile interfaces for several years. More recently, we began applying this technology in retail to test physical product displays. With mobile eye tracking, we can now follow consumers’ gaze while they shop and move between aisles. We collect data using glasses equipped with small cameras that allow for real-time binocular tracking. For this particular study, we used SensoMotoric Instruments (SMI) eye tracking glasses.
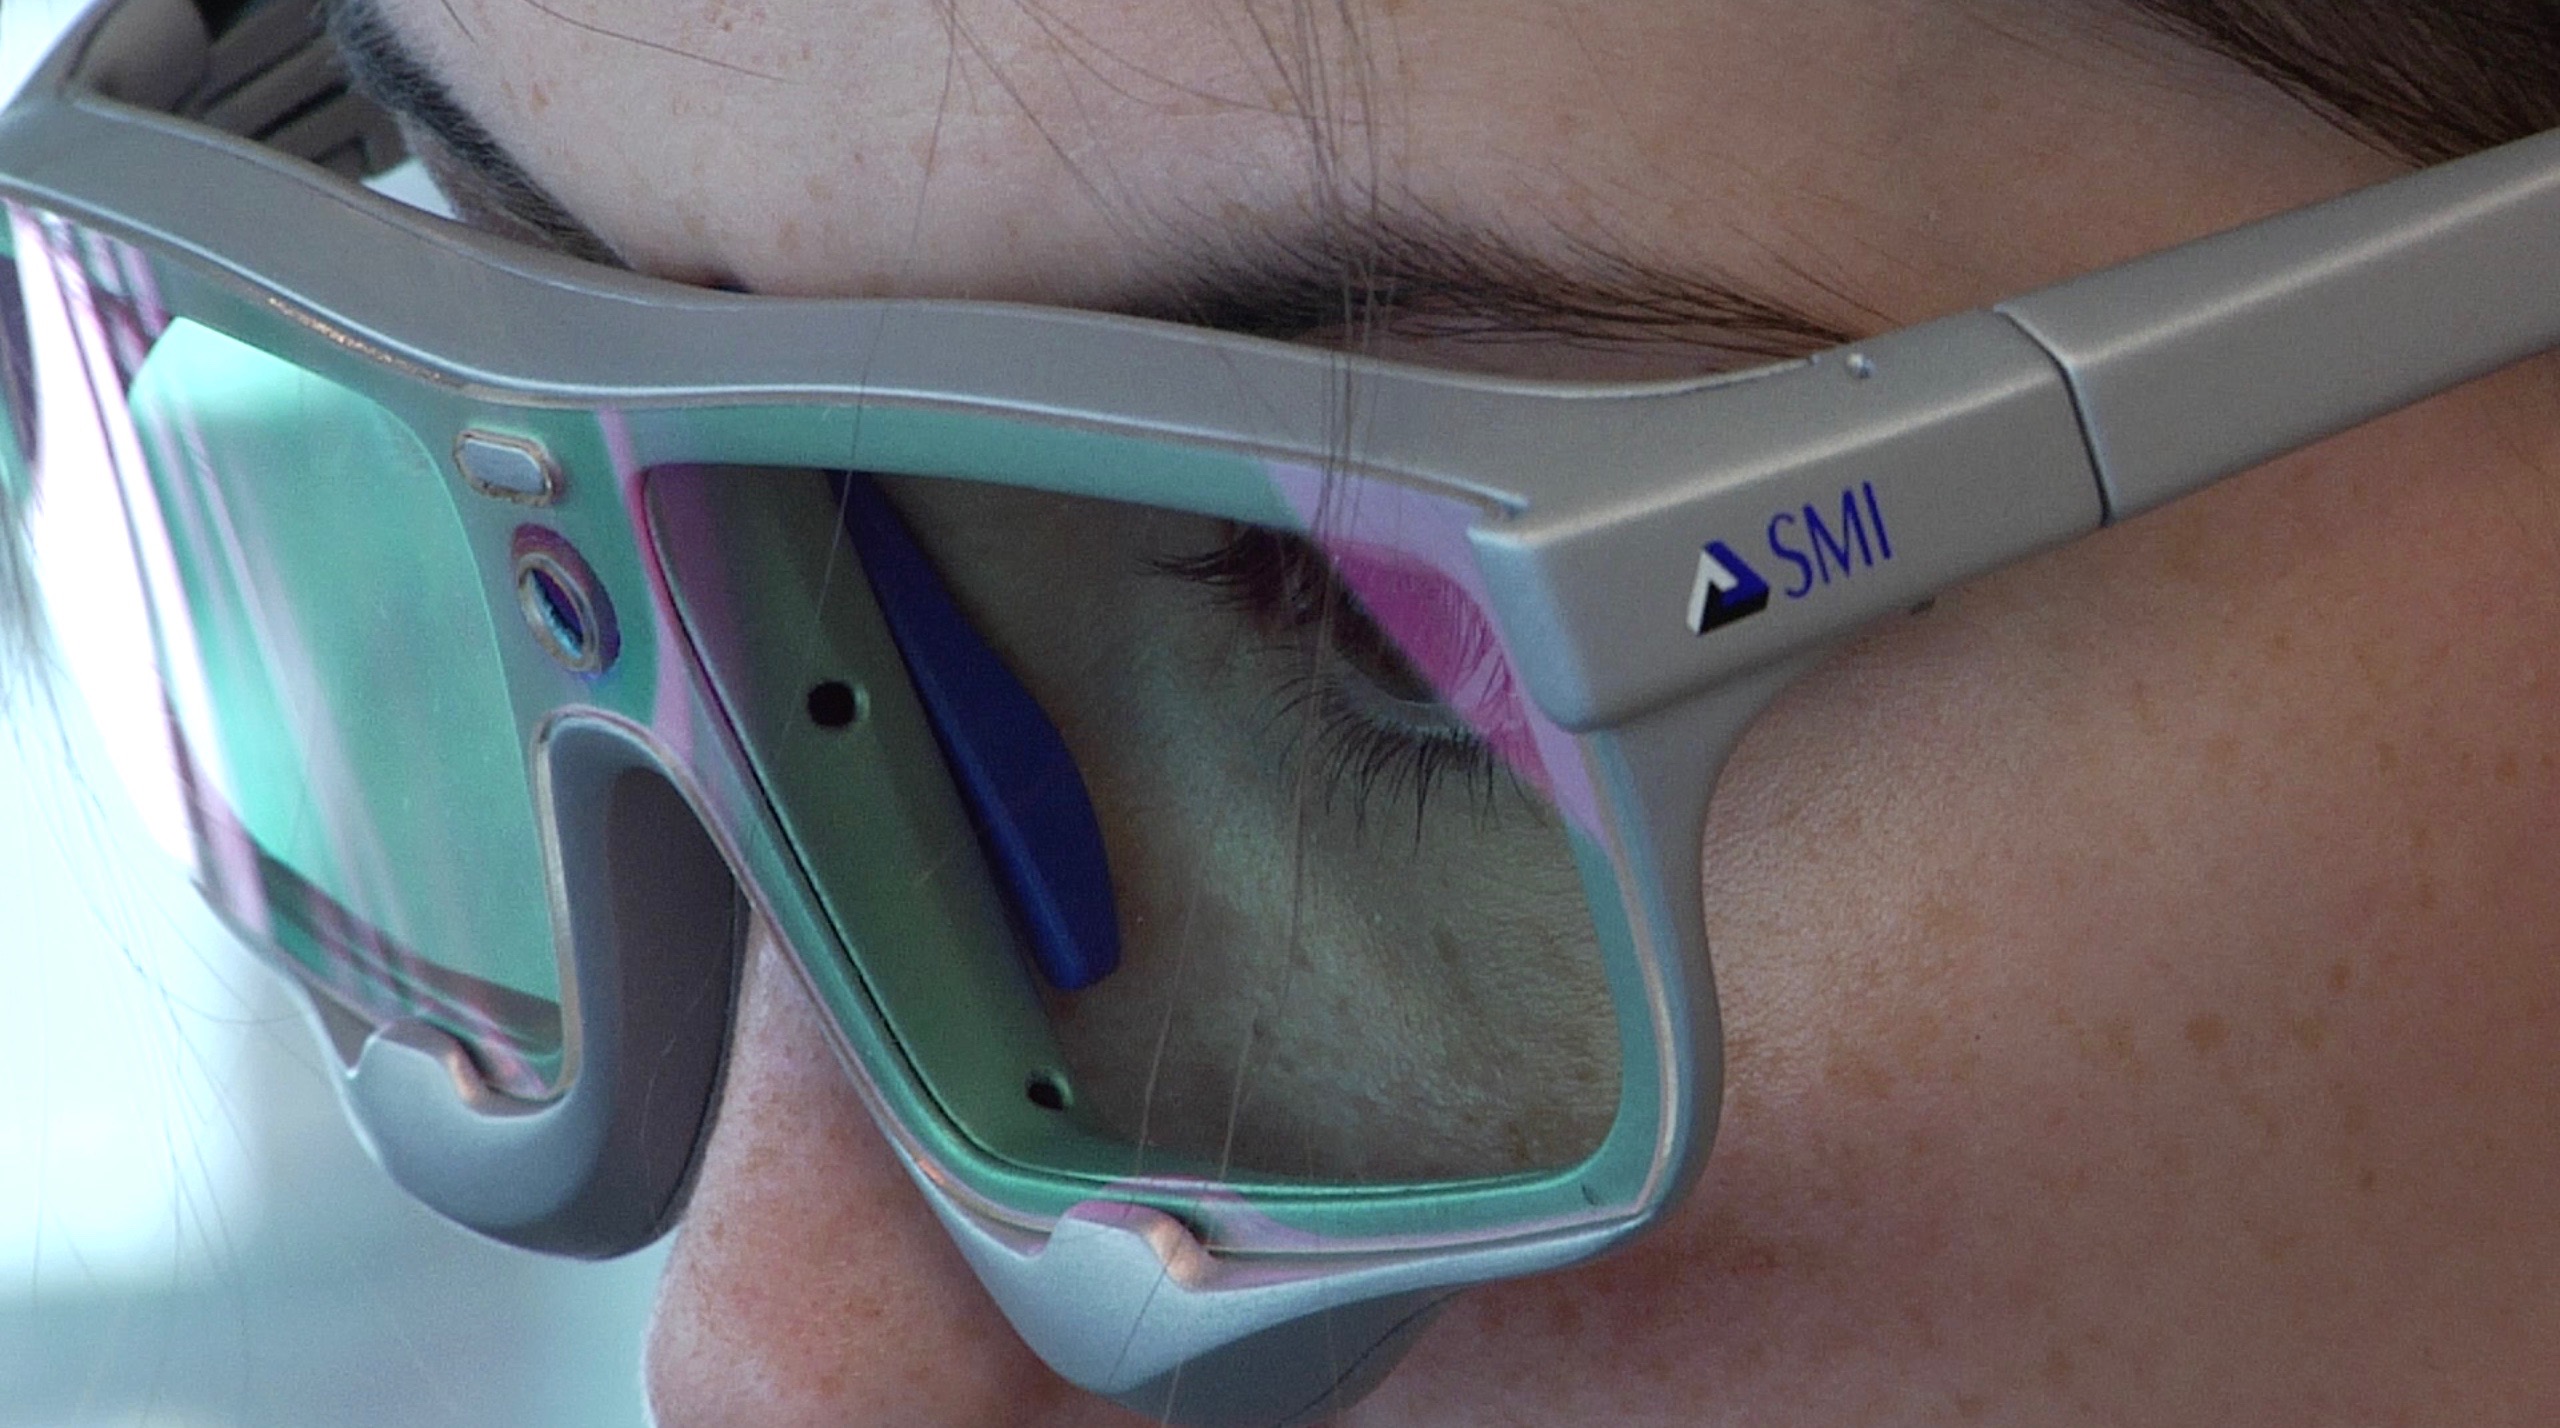
SMI eye tracking glasses used for our study
Glasses are connected to a smart recorder, similar to a smartphone, so participants can move easily. This is how we were able to record what participants looked at every step of their shopping experience. What about precision? Eye tracking glasses are precise enough to know exactly which part of a label a client looked at. This technology is ideal to objectively identify what grabs consumers’ attention in a physical store.
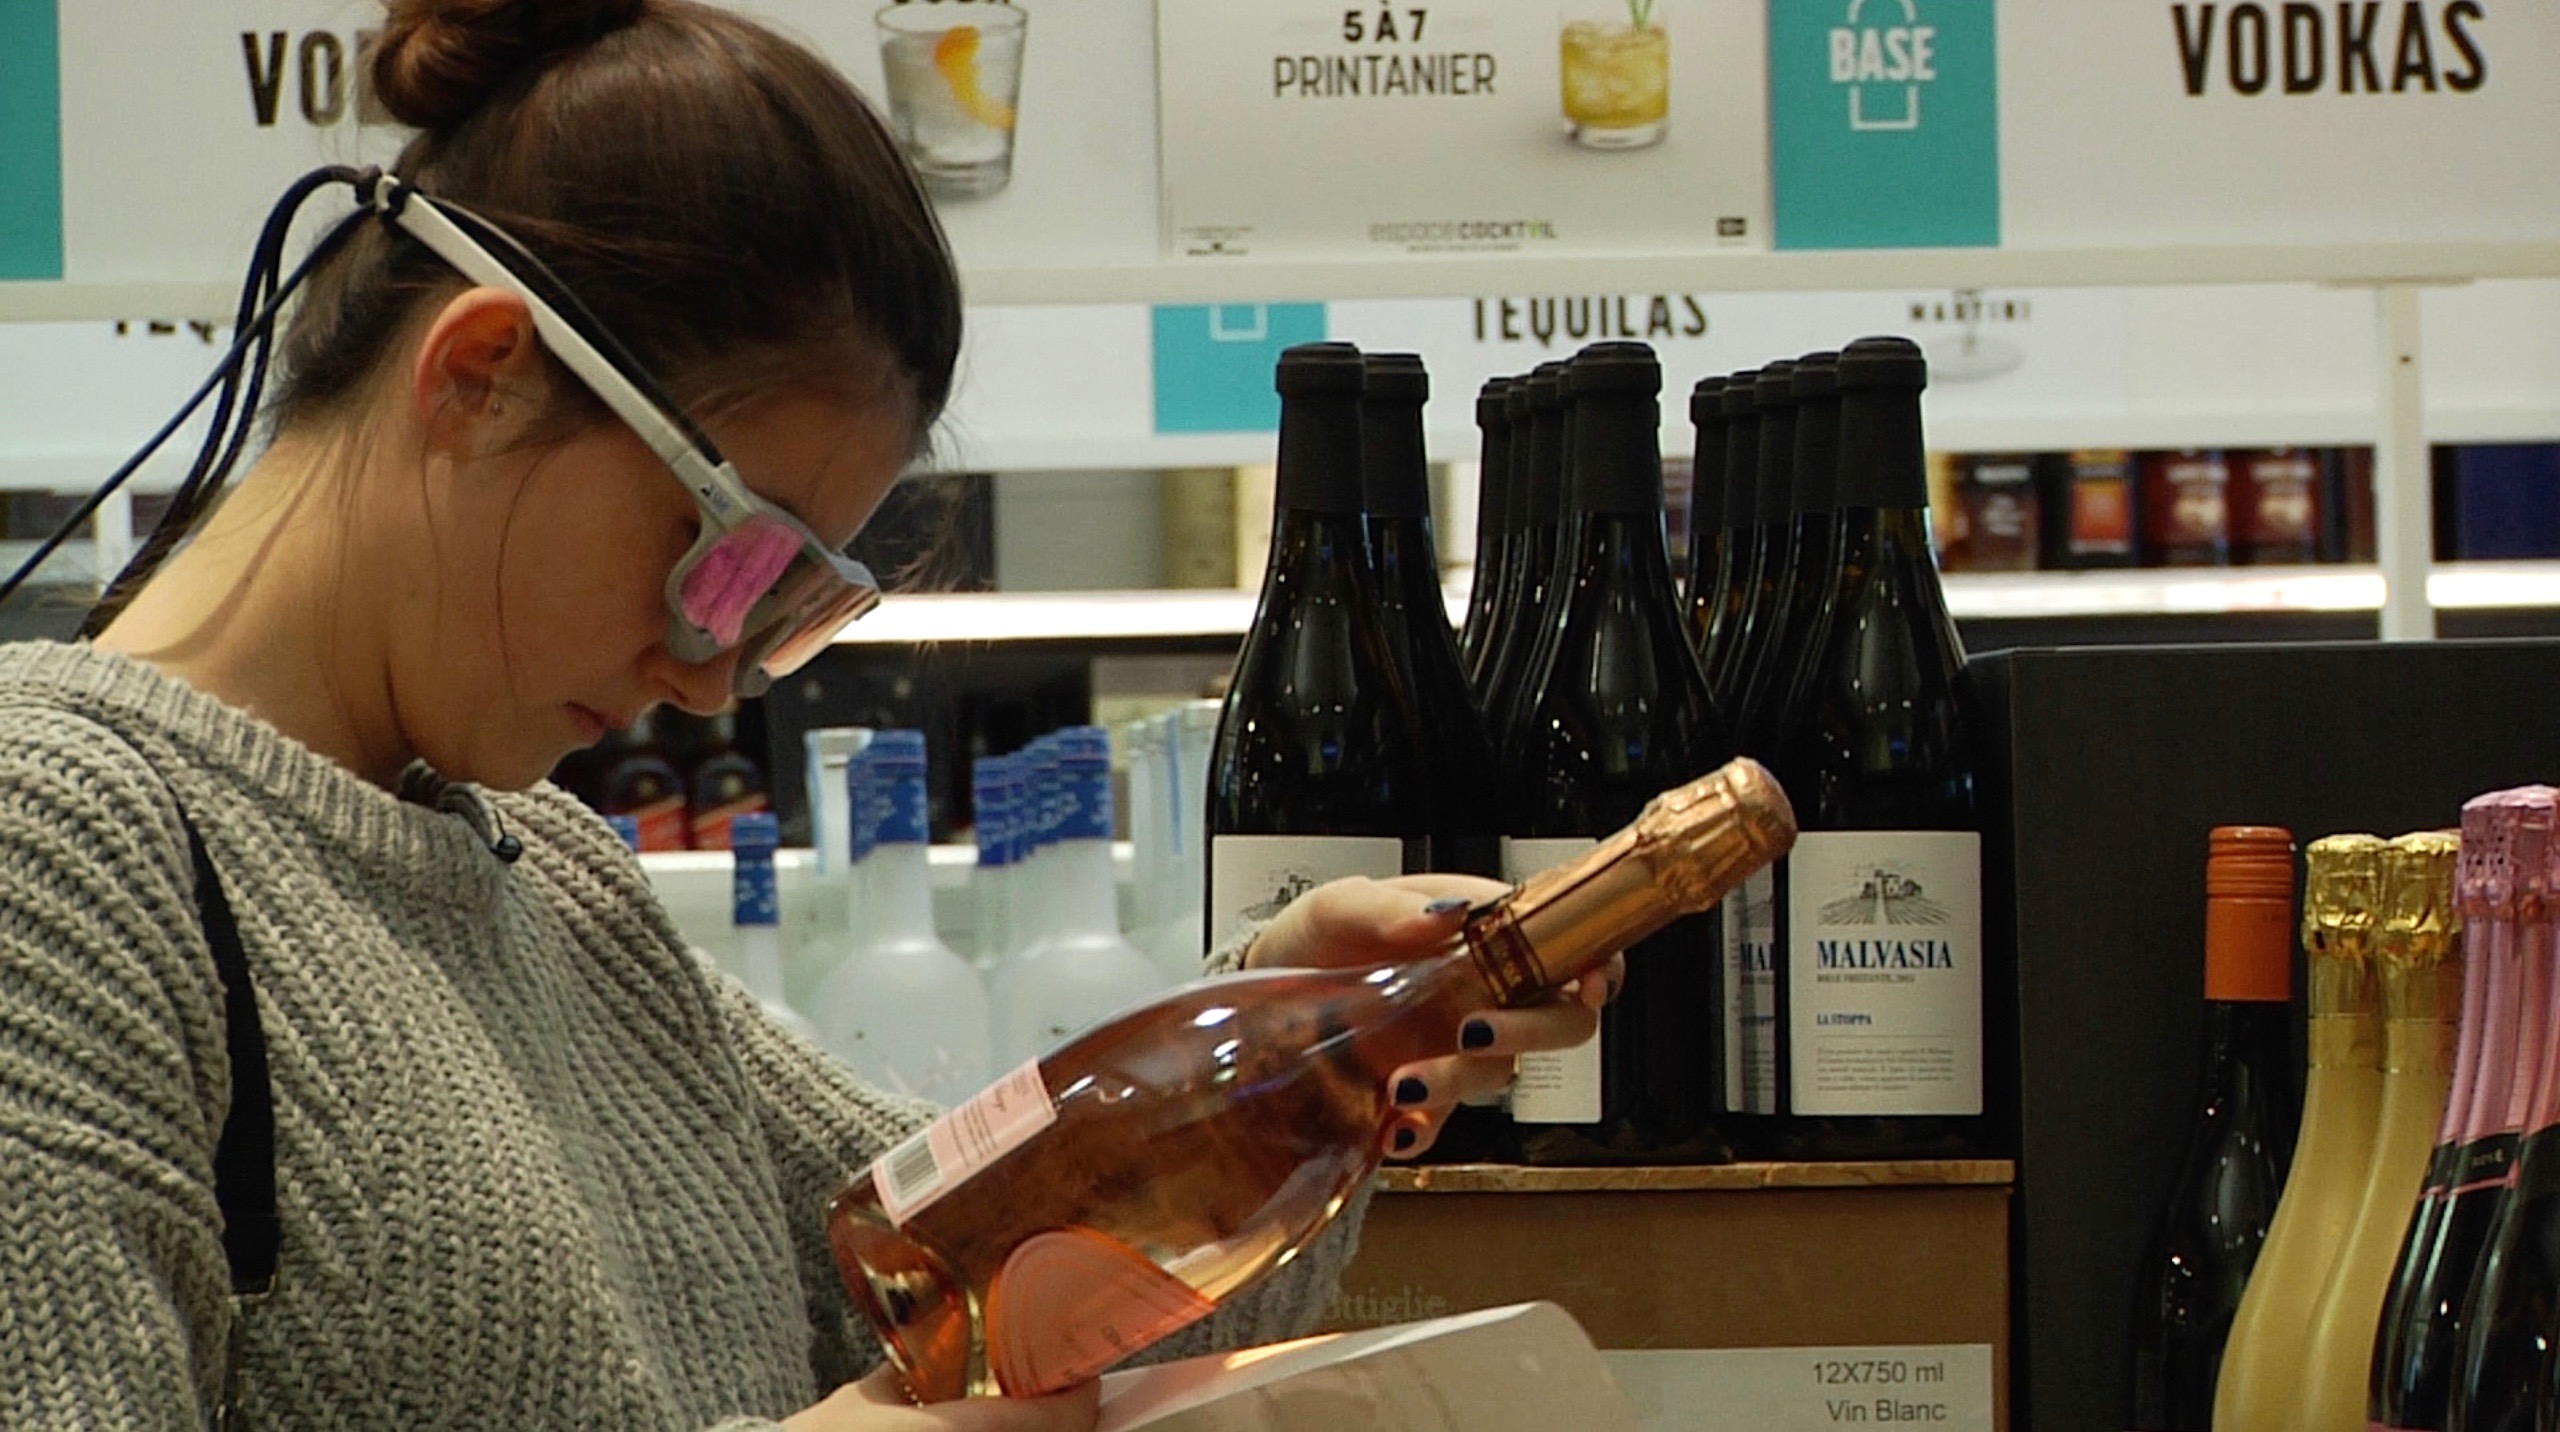
Participant reading the label of a sparkling wine bottle
First Impression
What is clients’ first impression when they enter an SAQ store? What do they look at before moving toward a specific section?
Before participants began shopping, they looked at shelves located right in front of them. To figure out where to start, they also scanned the signs near the ceiling that identify the different store sections. This is what the heat map below illustrates. Red zones were looked at the longest followed by yellow and red ones. Three pictures were combined in order to recreate the view participants had when they looked left, center and right when they opened their eyes.
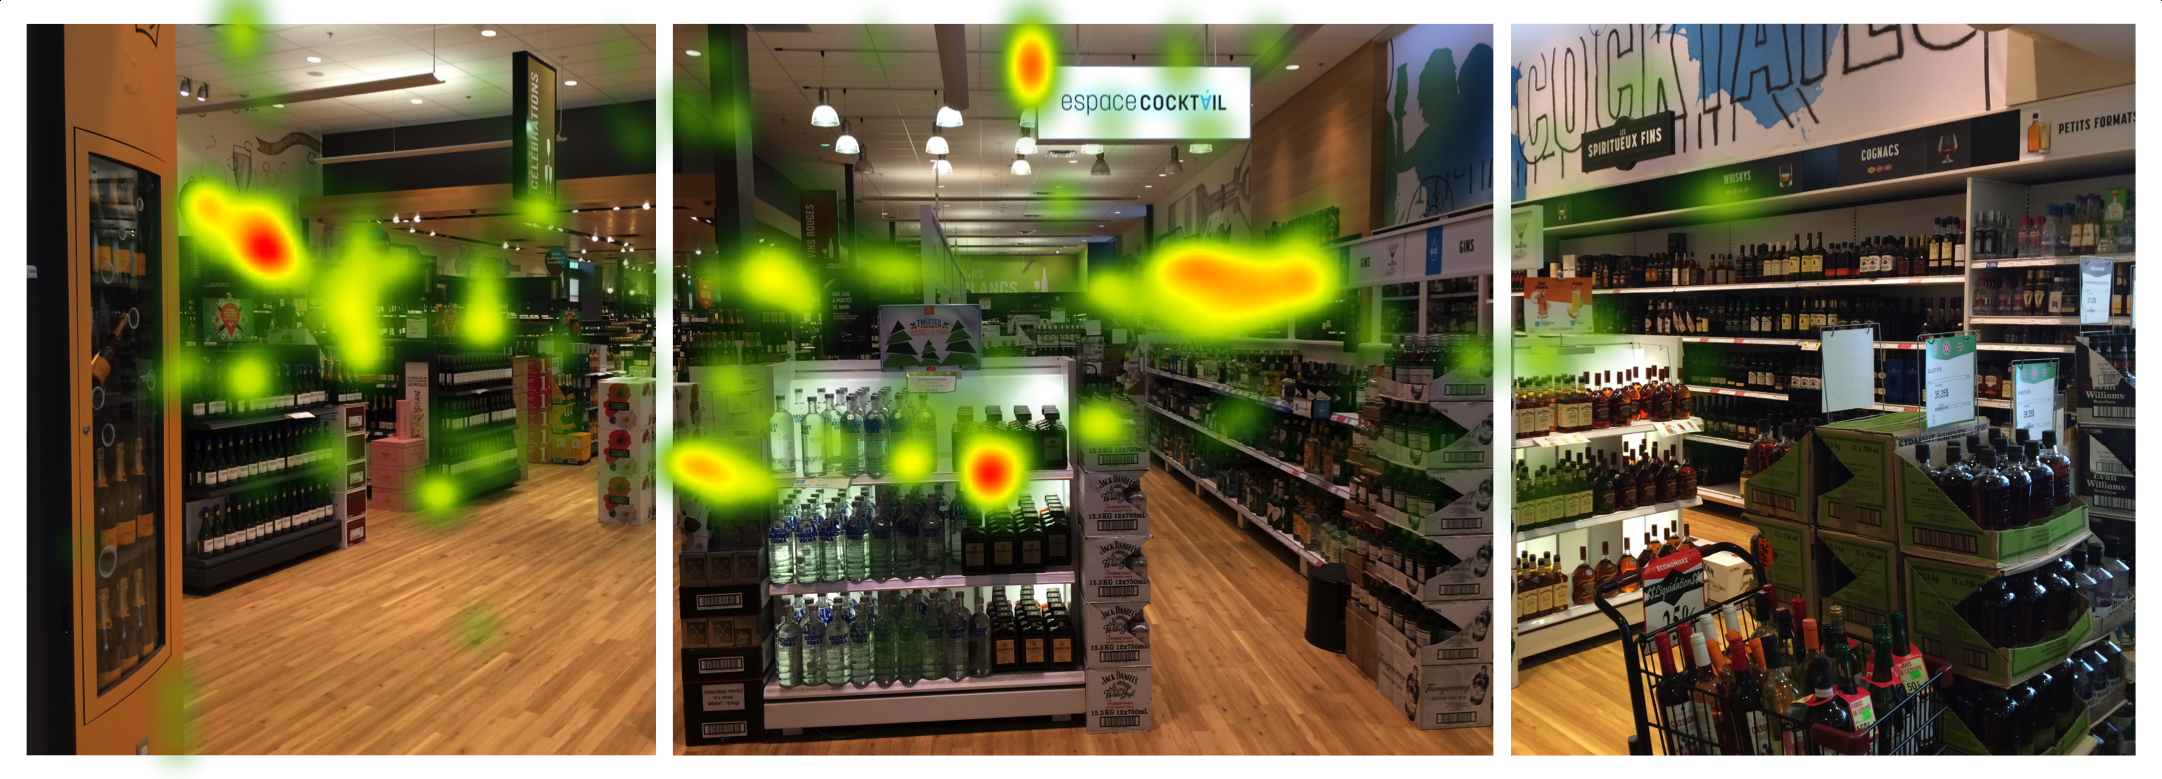
Heat map showing store’s entrance with aggregated results for all participants
To analyze first impression, we divided the store’s entrance into three areas of interest: top part of the store with signs, eye level products and featured product on the left (Veuve Clicquot champagne display in that case). Participants first noticed eye level products, mainly the shelf in front with Absolute Vodka and Disaronno Amaretto. They then moved their gaze to the top part of the store and to the featured product. They spent an average of 5,2 seconds looking at the top of the store to get an overview, 3,9 seconds looking at eye level products, and 0,2 second looking left at the Veuve Clicquot display. Areas of interest are presented on the heat map below. Numbers indicate average order in which participants saw each area when entering the store.
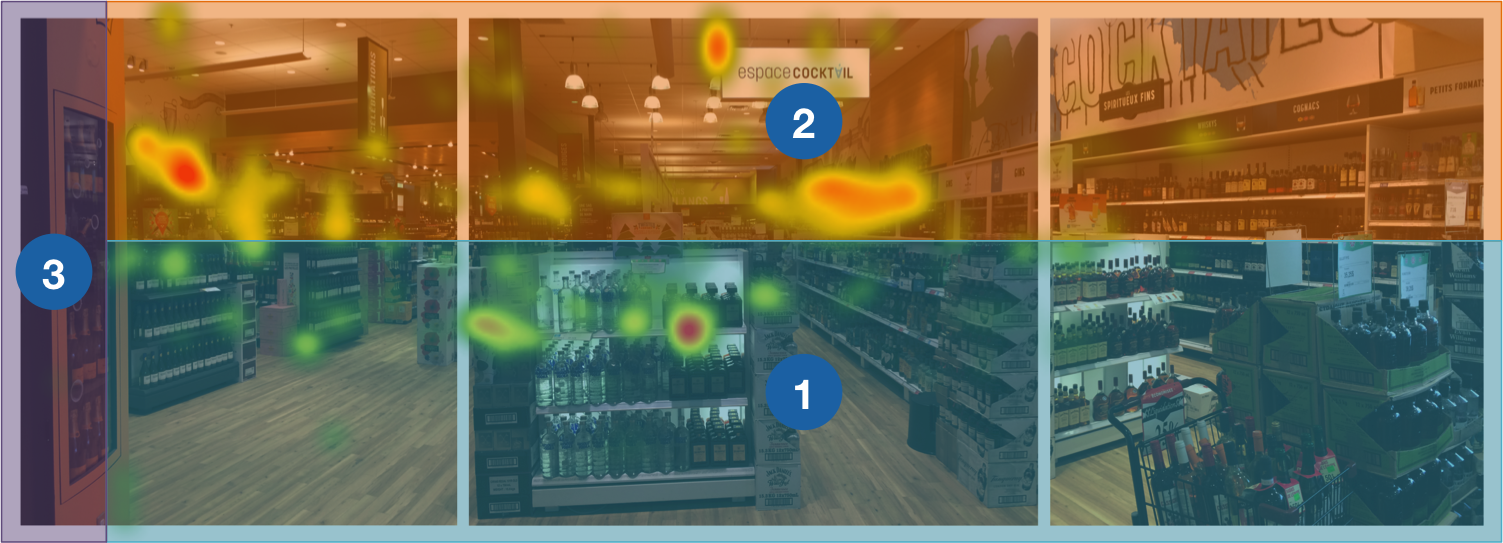
Heat map showing average order in which participants saw areas of interest (attractiveness)
The shelf right in front of participants got their attention first which is not surprising. However, participants spent more time looking at the signs on top of sections to decide where to go in the store. This behavior is understandable considering participants had clear needs when they started shopping. We suppose it is also the case for most SAQ clients. Consumers often have an idea of what they are looking for when visiting that type of store even though it is not specific: white wine to pair with fish, bubbles to celebrate, a fine spirit to create fancy cocktails, and so on.
SAQ could benefit from signs located on the top part of the store to put forward some products or promotions. We can expect clients to notice them while browsing the store to find what they are searching for. Shelves facing the entrance are also a good choice to make sure a product is noticed. Clients will look at them briefly for sure.
Decision-Making in the Aisles
In an aisle with shelves, which positioning is most likely to grab consumers’ attention? To encourage them to select a product?
We analyzed participants’ gaze path for three rows of shelves: one with aperitifs and desert wines, and two with sparkling wines. All had the same structure: three rows of shelves and two product displays on both sides. It was easy to predict that the top shelf would grab participants’ attention the longest since it’s at eye level. However, the bottom shelf performed better than expected. The heat map below shows that participants looked a little less at the middle shelf than the others…
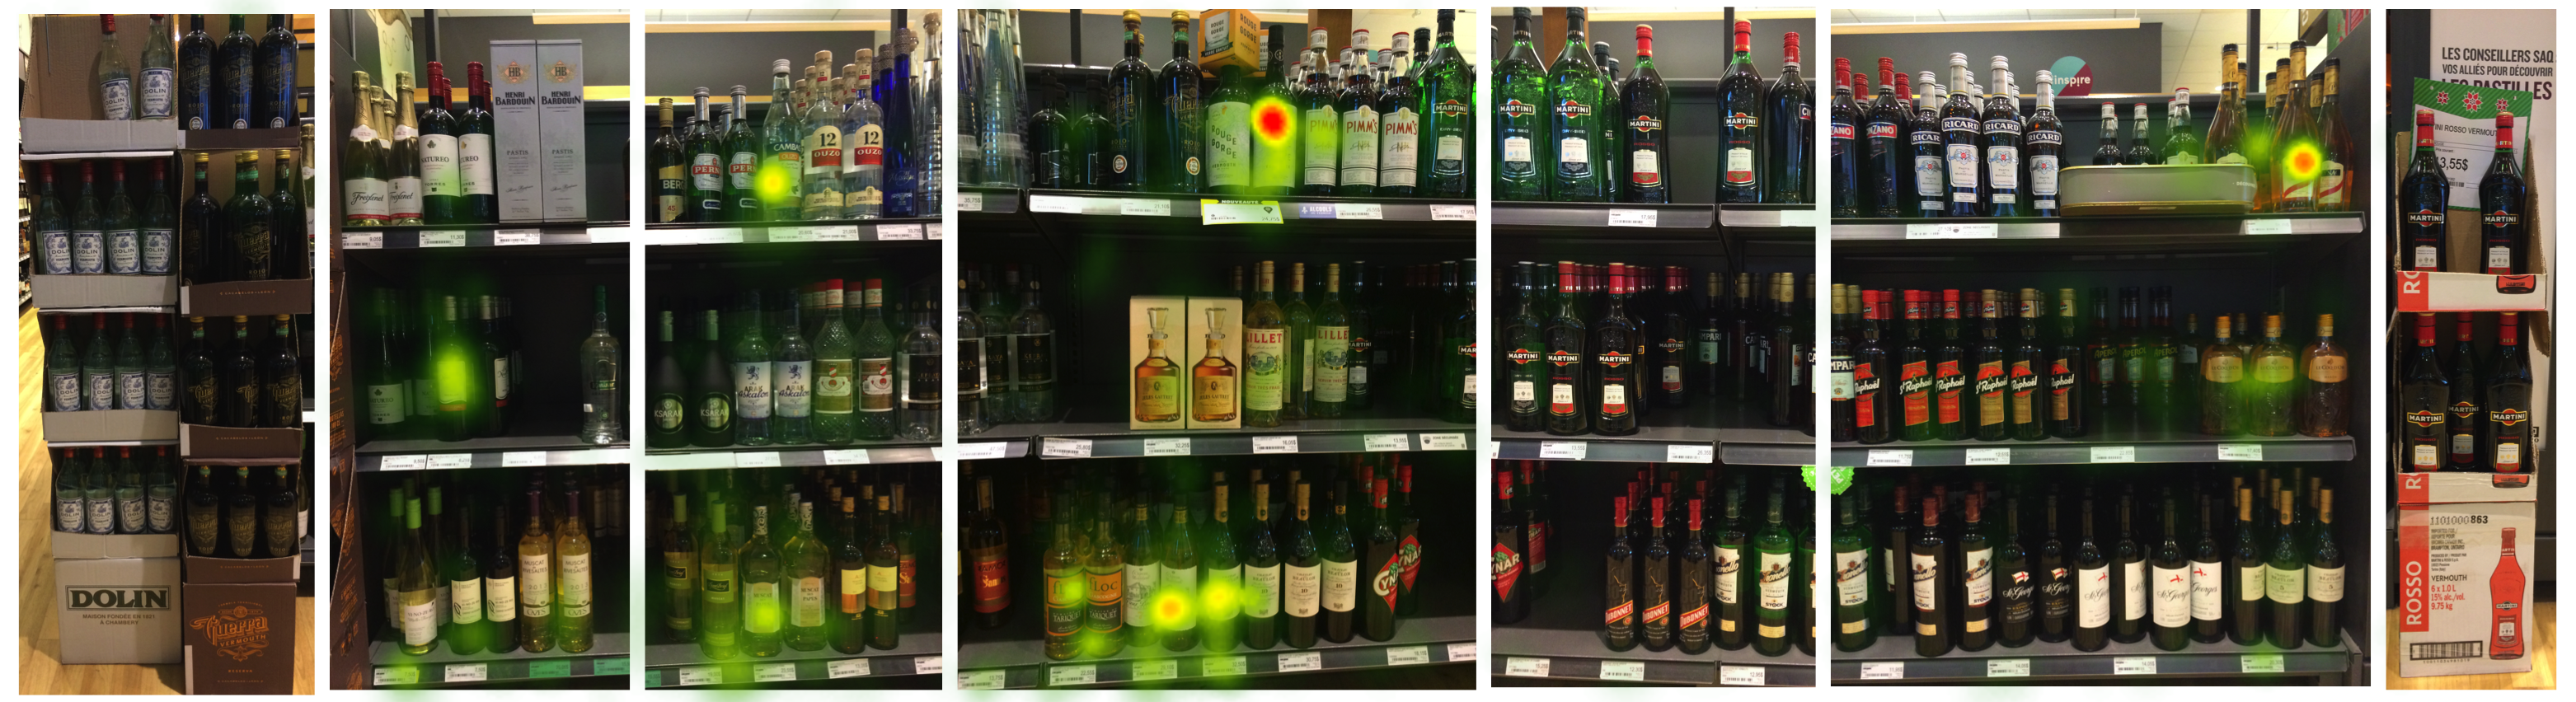
Heat map showing aperitifs and desert wines with aggregated results for all participants
In the rows we analyzed, participants looked at the top shelf for an average of 24,1 seconds, at the bottom shelf for 20,6 seconds and at the middle shelf for 20,4 seconds. We tend to think intuitively that bottom shelves grab client attention the less. Our study showed that this is a false assumption; bottom shelves even did a little better than middle. Participants only look at featured products on the sides briefly as it was the case at the store’s entrance. They looked at them for an average of 0,6 second. Gaze path was pretty linear. Participants first noticed top shelves, middle shelves and bottom shelves before paying attention to product displays. Therefore, eye level products are the most attractive ones as illustrated in the heat map below presenting the four areas of interest:
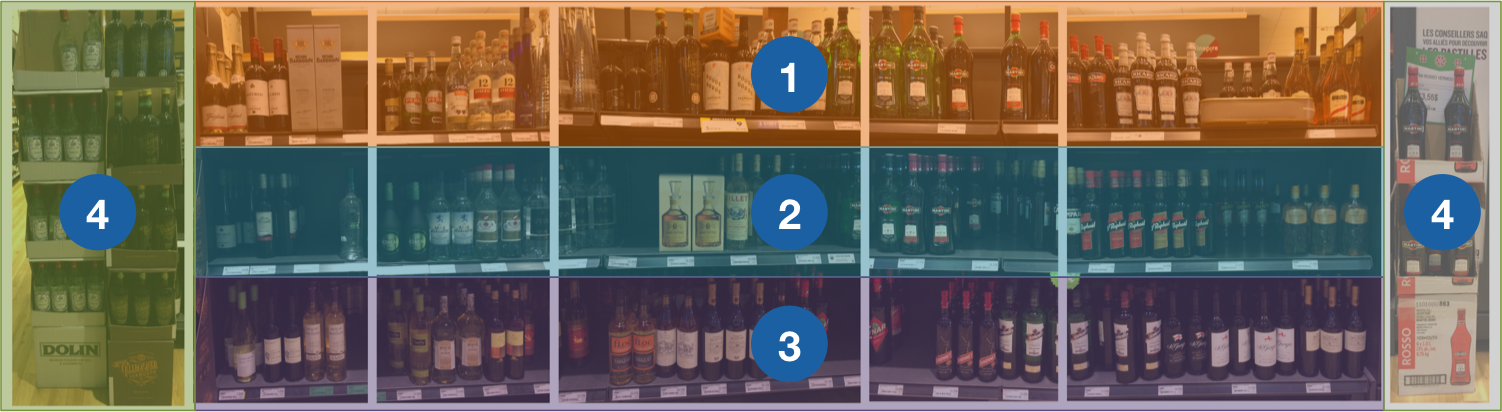
Heat map showing average order in which participants saw the four areas of interest (attractiveness) (average results for all three rows of shelves we analyzed in our study)
In addition to being noticed first, the top shelf is also looked at the longest. Again, it was easy to predict considering it is at eye level. We were surprised to discover that participants paid more attention to bottom than middle shelves even though they took more time to be noticed. The top shelf clearly wins but which of the bottom or middle shelf performs best to grab consumer attention? Based on products chosen by participants, it is clearly the bottom shelf. It seems like consumers pay more attention to extremities of their field of view once they are done browsing for an overview. Participants chose a total of 24 products. Among them, 9 came from the bottom shelf, 8 from the top shelf and only 6 from the middle shelf.
SAQ should focus on top shelves to grab clients’ attention in-store and turn to bottom shelves as a second choice. As for featured products, they do not draw consumers attention when they are shopping in a specific section. SAQ can however make these product displays visible from the most possible places. It is likely that clients will notice them while moving from a section to another in the store. They are not fully focused on their needs or shopping during transitions. Recordings showed that participants moved their gaze the most while walking between the entrance, aperitifs and desert wines, and sparkling wines. They looked at various product displays during transitions even if featured products were not on their shopping list.
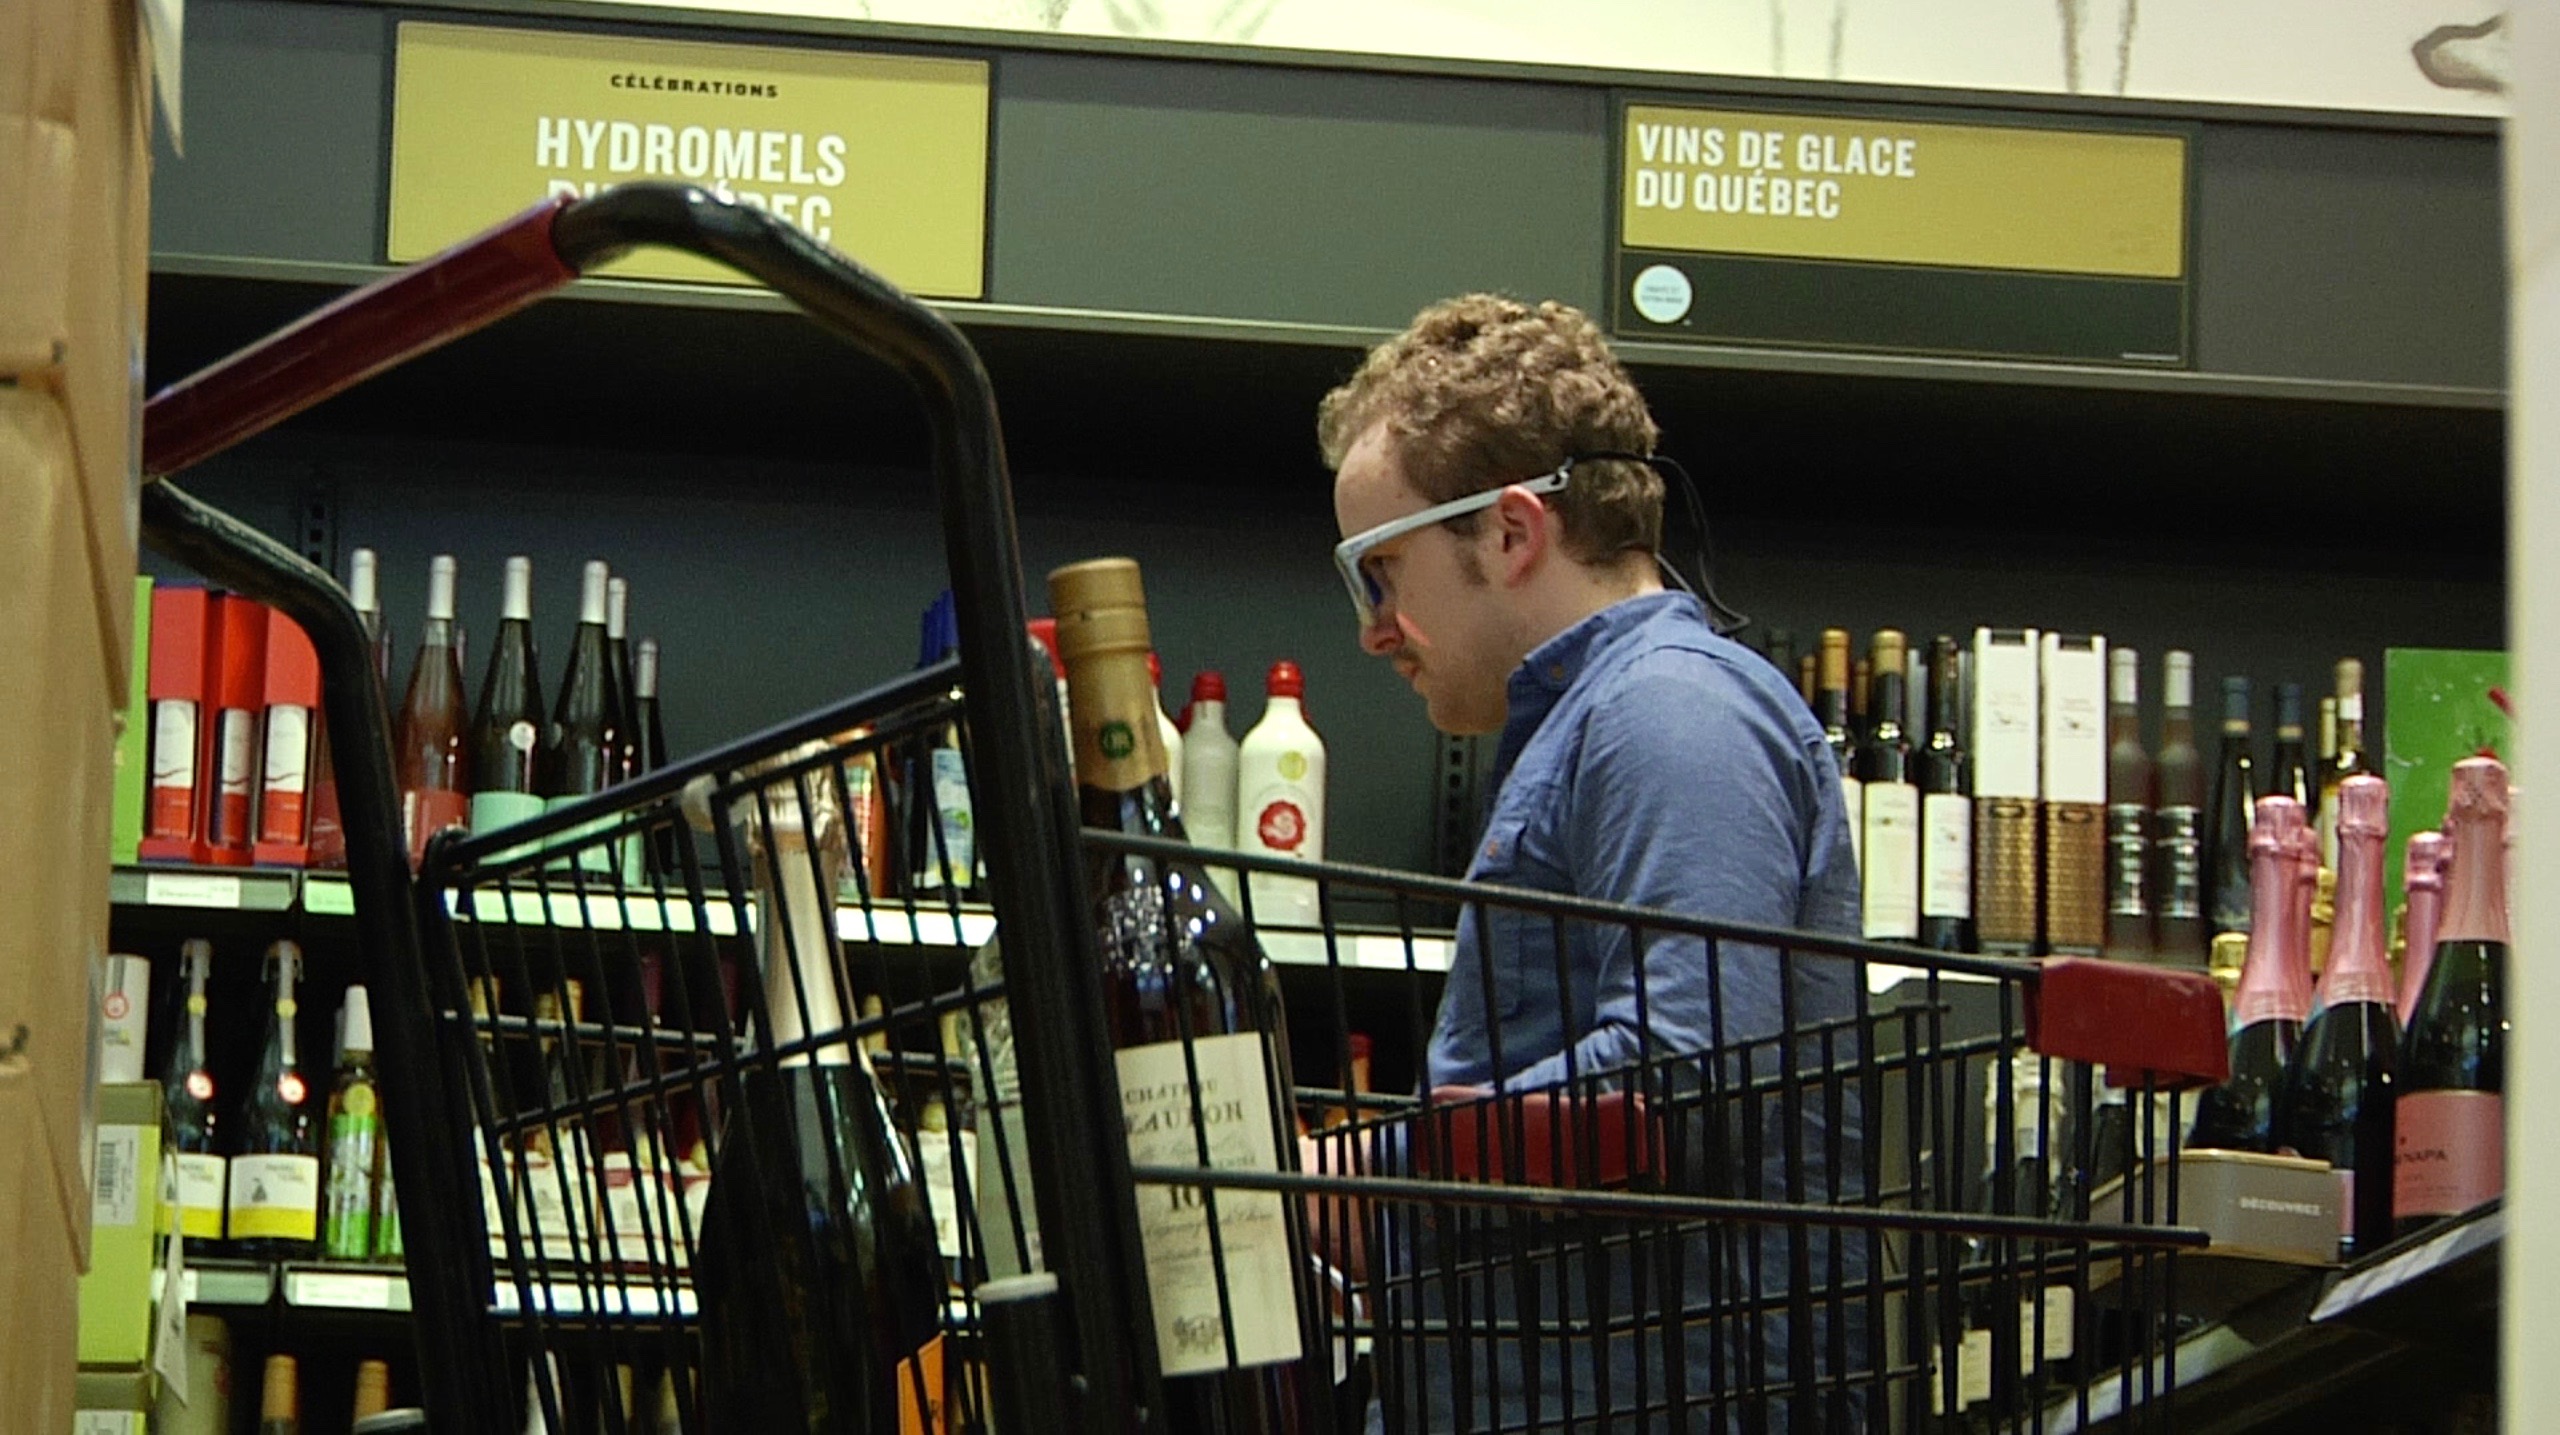
While moving between two sections, this participant stopped to look at honey wines.
5 Good Practices for SAQ
Our question was: What grabs client attention in the aisles and how product positioning impacts product choice. We answered it using mobile eye tracking. We summarized our key findings in 5 good practices for SAQ stores:
- Benefit from shelves facing the entrance to make sure a product is seen.
- Use signs on the top part of the store to promote products.
- Choose top shelves to grab client attention in the aisles.
- Consider bottom shelves as a second choice instead of middle shelves.
- Make sure promotional product displays are visible from everywhere.
Some more intuitive than others, those good practices are guidelines to grab consumers’ attention in physical stores. They are specific to our study and SAQ but can be applied to other retail settings. Nevertheless, we would expect results to differ for other types of products and shelves. In a store with a more hedonic orientation, it is likely that clients will pay more attention to featured product displays. For example, it might be harder to focus we need to buy in a bakery than a drugstore! Lightning might also have a strong impact on consumers’ experience in retail stores to guide them though sections.
By conducting this study, we wanted a global overview of what grabs client attention when they visit an SAQ store during the Holidays. With mobile eye tracking, we are able to create scenarios adapted to all kinds of business goals. We can also move from general to specific. In our case, we could have looked at each product individually to see which bottles were the most attractive for example. Eye tracking glasses are especially useful to compare different versions of a same product display.
Next: How to Grab Clients’ Attention Online…
What about online shopping experience at the SAQ? Do consumers behave the same way online than off line? Do they choose the same products?
In addition to asking participants to choose products in-store, we asked them to do a similar task on SAQ’s online store with eye tracking glasses. We were able to measure their gaze path on different web pages. In another publication, we will compare our eye tracking results for in-store experience and online experience…
Are you curious about this study? Do you want to know how mobile eye tracking can be useful for you? Contact us or follow us on social media to say tuned!
***
We would like to thank Catherine Dagenais and Lilli Prud’homme from SAQ for allowing us to go forward with this study, Benoît Cusson and Roberto Ciocca from the Atwater Market SAQ store who collaborated with us. This project would not have been possible without the precious collaboration of OPTECH who lent us their eye tracking glasses. We would like to thank Maroun Massabki, Director of Development and Innovation, and Bruno Santerre, Communications Teacher, for their support and enthusiasm. Finally, we want to mention contributions of Florian Cruzille, student in journalism in charge of documenting our study, and Julien Colimon, Optical Technician at OPTECH.


