Putting Chatbots to the Test: Is Artifical Intelligence Better Than Websites?
Chatbots are robots that simulate conversation with human users through instant messaging services like Facebook Messenger. In the last year, several brands launched chatbots and promoted them heavily through ad campaigns. For example, you can now chat with a virtual chef (in French) on Quebec’s pork producers Facebook page. Guess what? The virtual chef can suggest many recipes to integrate pork in your menu. Such marketing initiatives usually catch the interest of consumers, businesses and media. It’s trendy, innovative and cool technology-wise… but is it really useful?
Can chatbots make our life easier? To answer this, we conducted a study with chatbots from different sectors of activity on Facebook Messenger. We put chatbots from Whole Foods (food and beverage), Tommy Hilfiger (clothing) and Skyscanner (travel) to the test. We invited ten participants to complete six precise search tasks using these chatbots. We asked them to do the same with websites from each brand. For example, participants had to find a salad recipe using Whole Foods’ chatbot and a salmon recipe using Whole Foods’ website. Conclusion? Based on our study, chatbots are not better than websites to fulfill users’ expectations. However, we believe this might change in the future.
User Experience Is Better With Websites Than Chatbots.
After each task, participants evaluated usefulness, ease of use, ease or learning and their satisfaction on a scale of 1 to 7. Results indicate that participants find websites more useful, easier to use and easier to learn than chatbots. They are also more satisfied with websites than chatbots. There is a statistically significant difference between chatbots and websites for each dimension mentioned above. Confidence level is 95% for ease of learning, and 99% for usefulness, ease of use and satisfaction.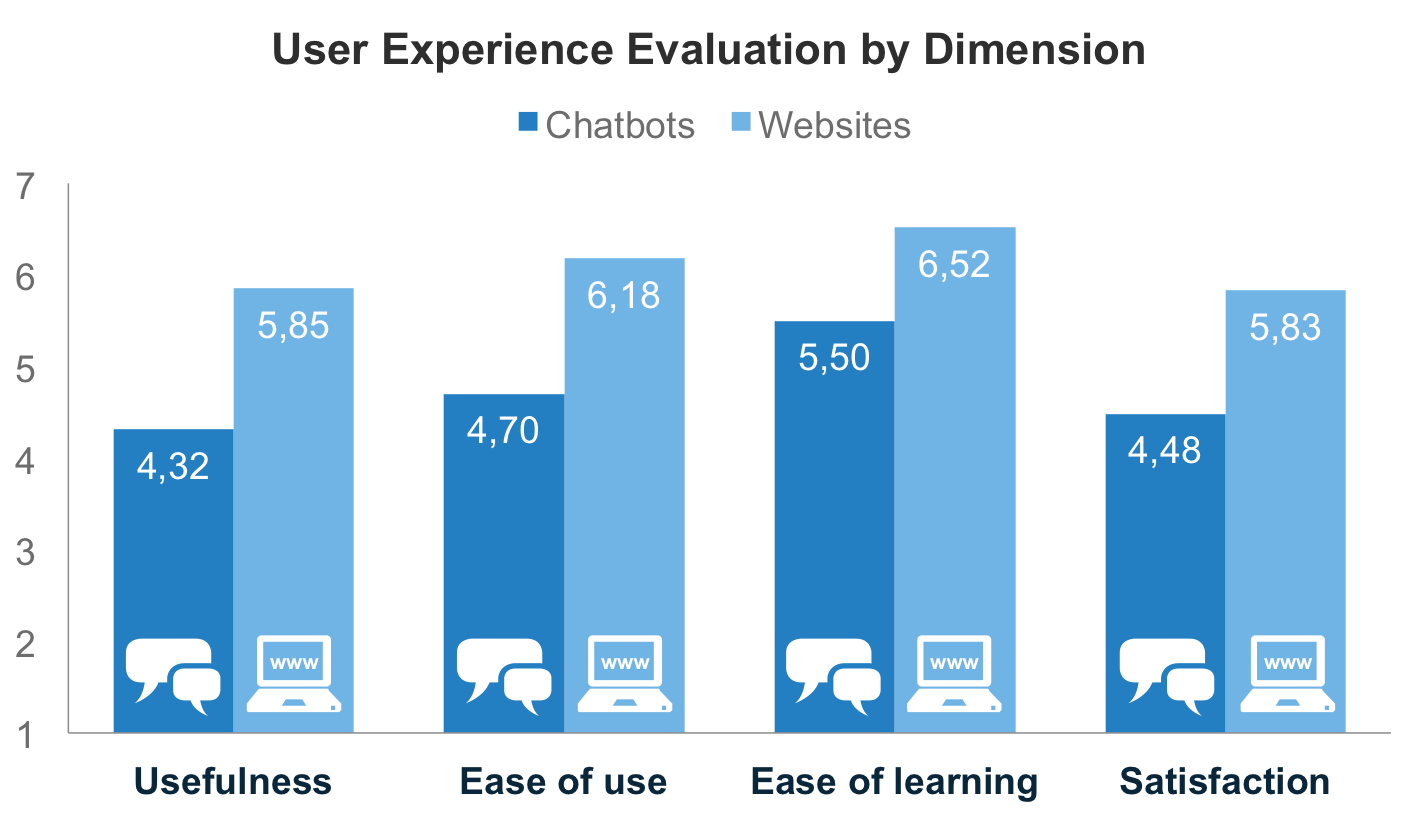 According to overall evaluation, participants like Whole Foods’ chatbot the most. They are equally satisfied with user experience provided by its chatbot and website. However, they preferred Tommy Hilfiger and Skyscanner’s websites than chatbots.
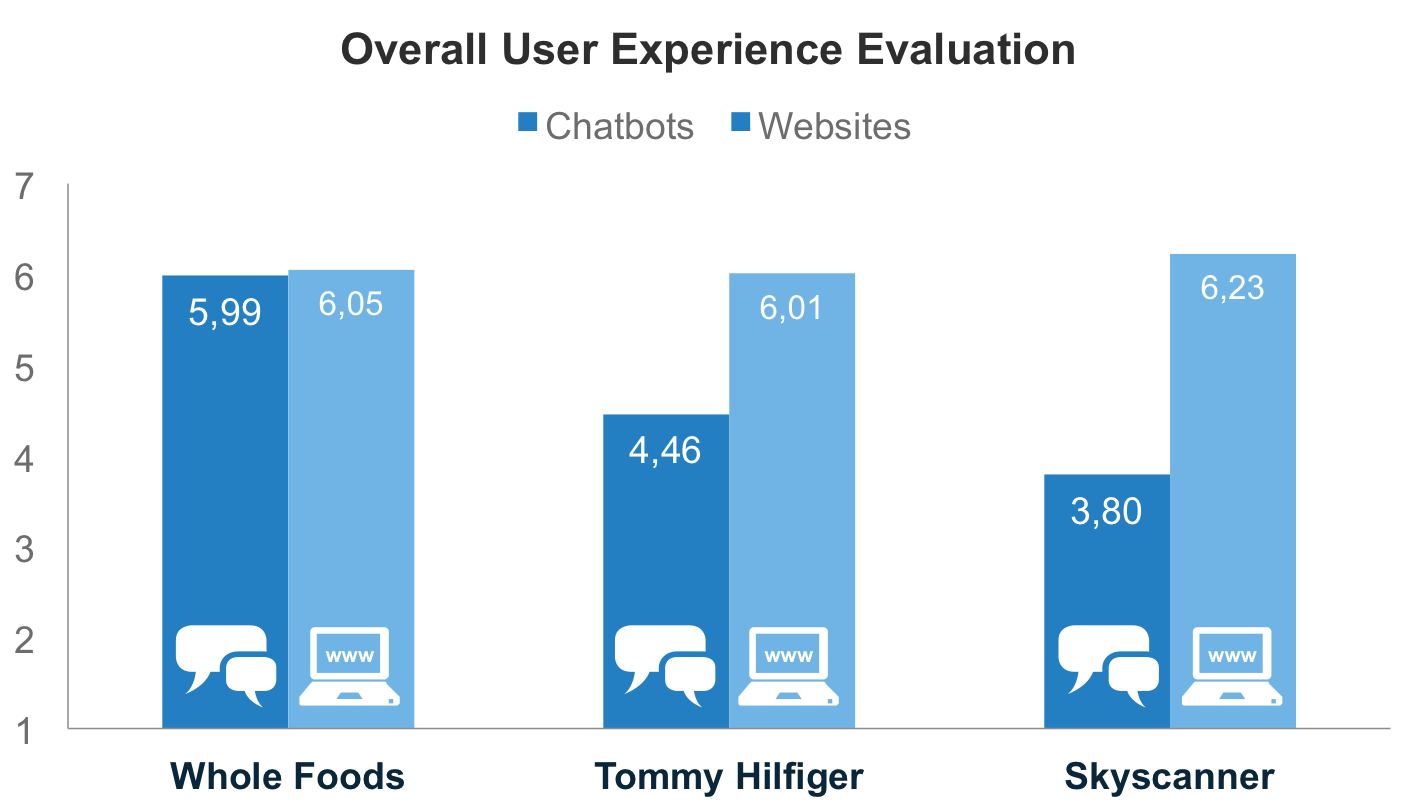
 Participants like to enter ingredients they have at home to get recipe suggestions in a few seconds. Chatbots and recipe search seem like a winning combination. This is probably why two participants spontaneously said they would like Ricardo Cuisine to launch a chatbot… but we should get back to Whole Foods! You have a butternut squash on hand and want to serve a salad as a starter for the Holidays? Done.
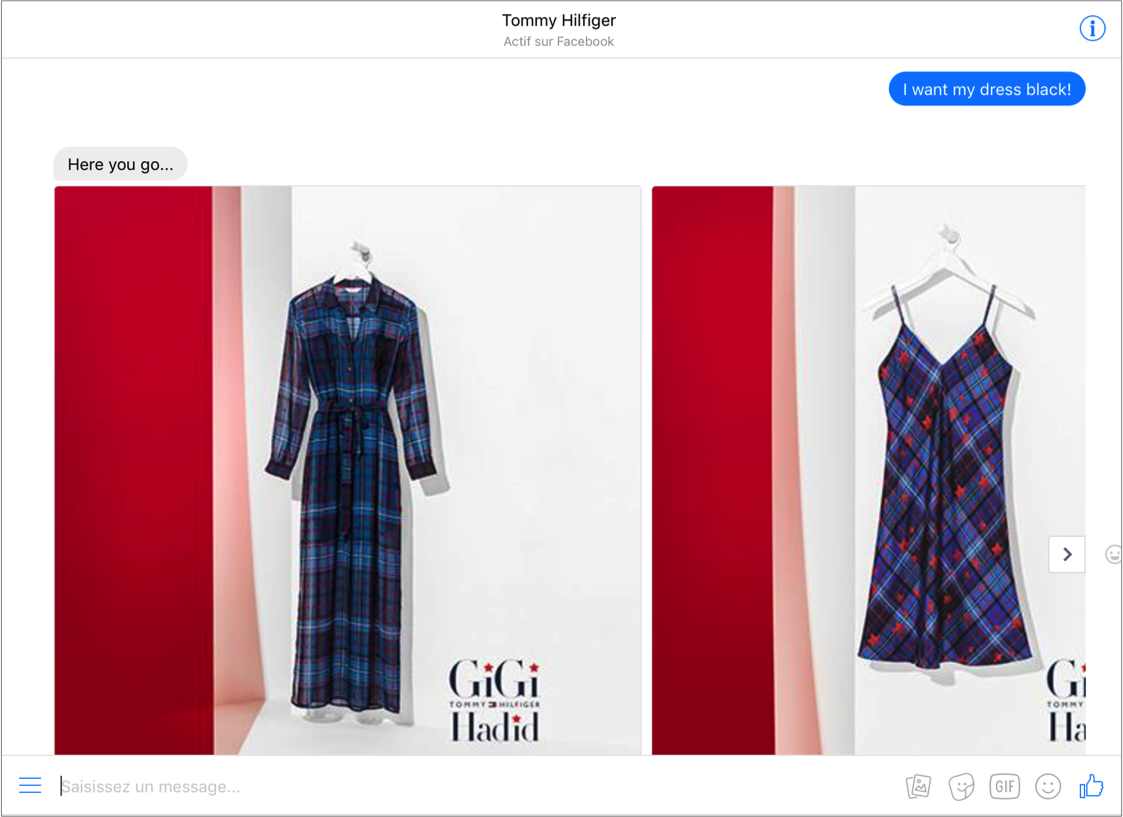
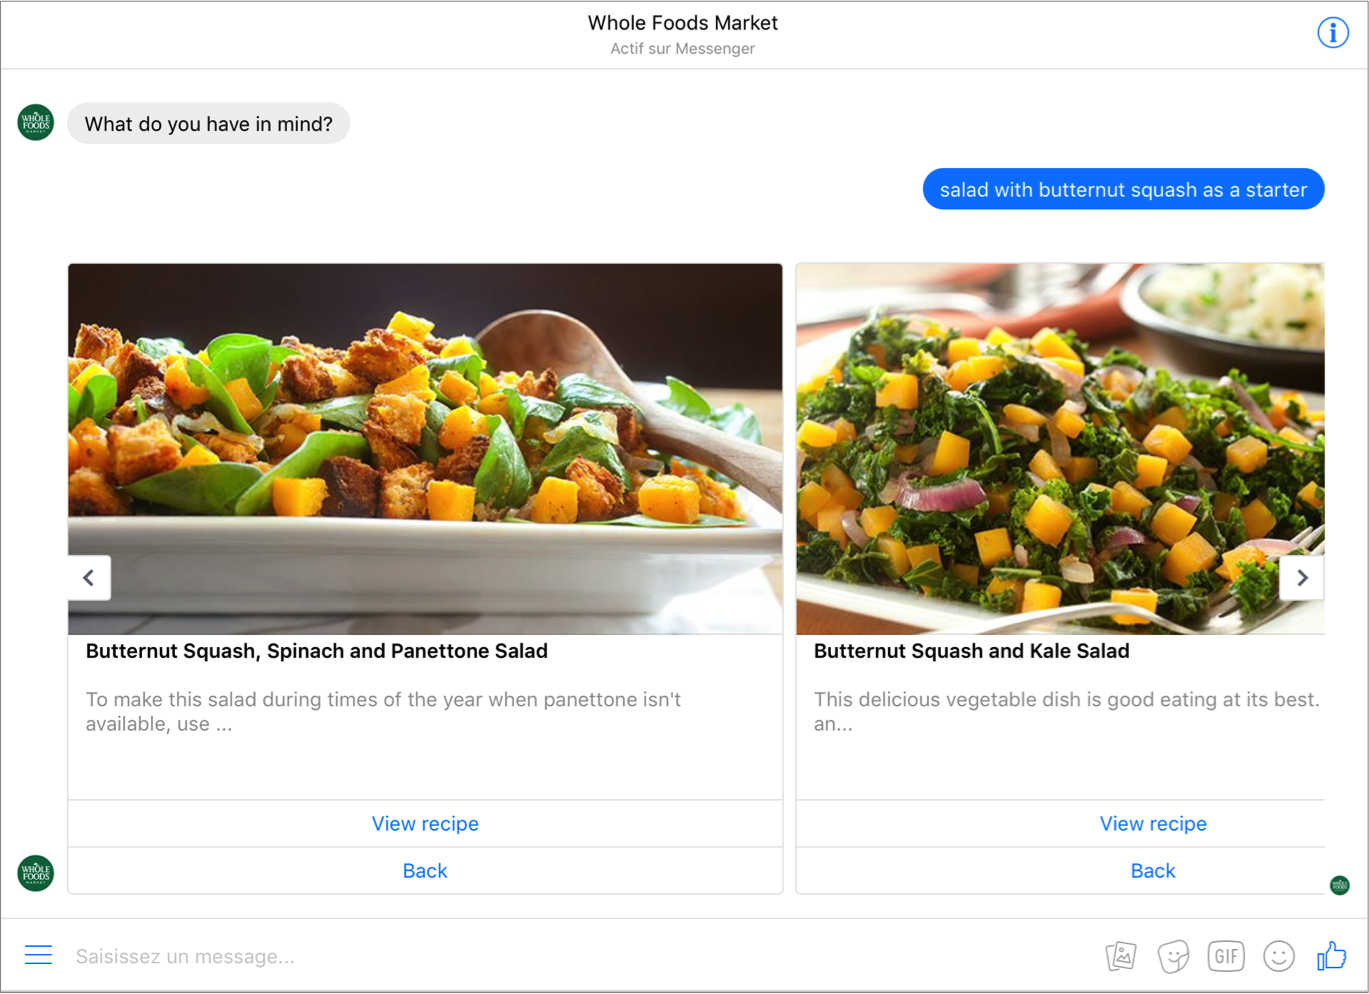 Whole Foods’ chatbot satisfied our participants quite quickly but with Tommy Hilfiger, something was missing. Participants felt they could not see the whole product selection to find the best product for their needs. According to them, search options are too limited with the chatbot. They find search filters easier to use on Tommy Hilfiger’s website. It should be noted that the brand’s chatbot seems programmed to make very broad recommendations. For example, here is what I get when I ask for a “black party dress”.
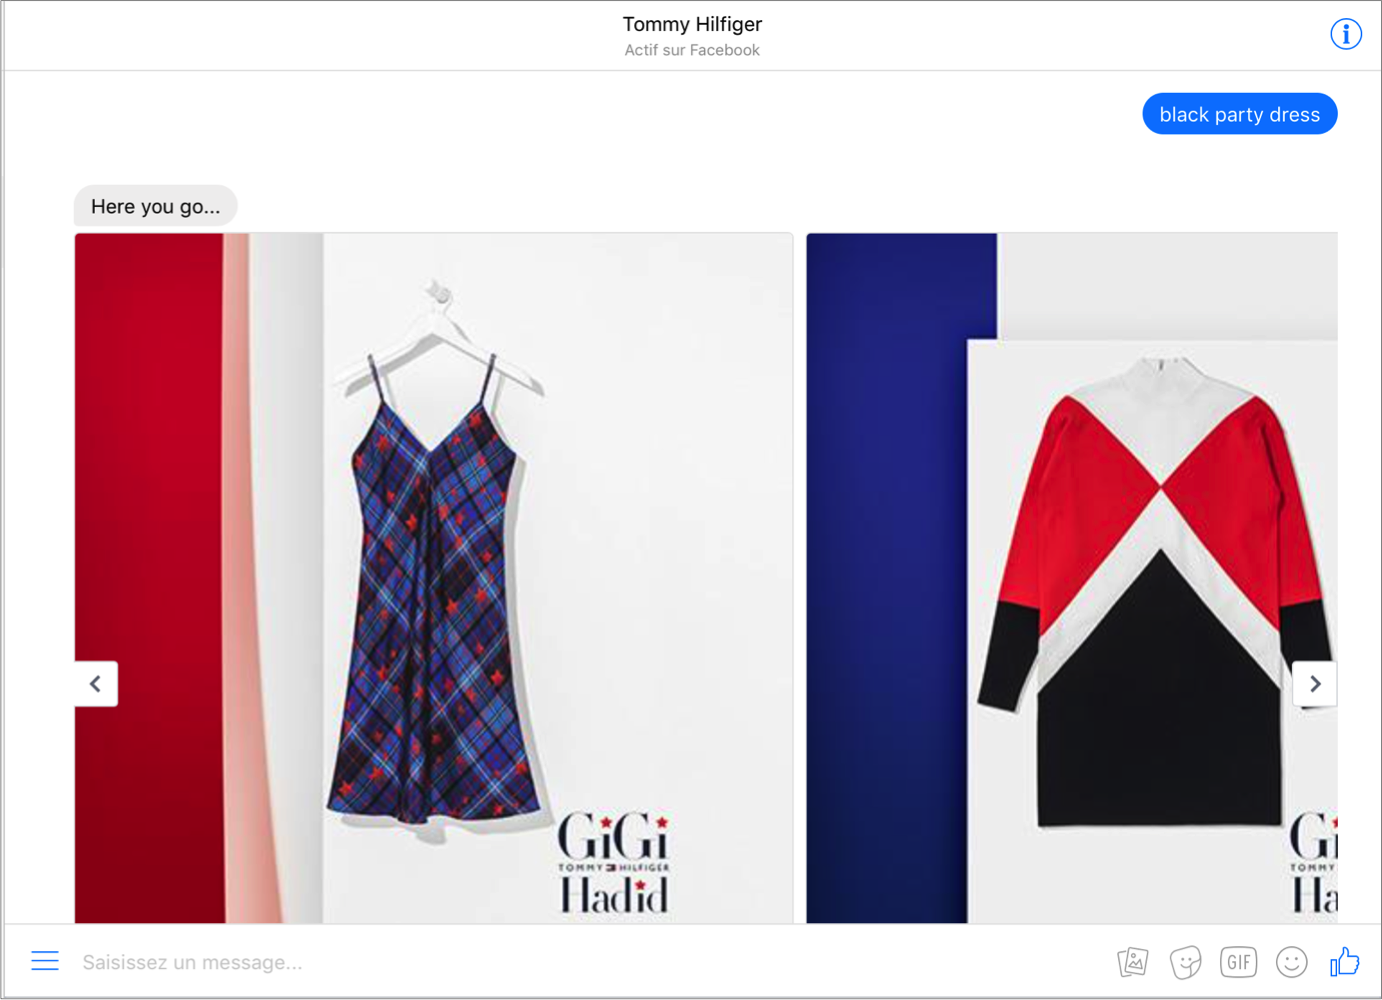 The chatbot understands I want a dress but nothing more. If I get angry by adding an exclamation mark, it still shows me the same dresses all over again.
Abandonment Rate Is Higher With Chatbots.
As researchers, our goal is always to create a setting that accurately reflects a real use scenario. With this in mind, we asked participants to navigate just like they would at home. Thus, some abandoned one or several tasks because they couldn’t find what they were looking for. Here is the abandonment rate for each task: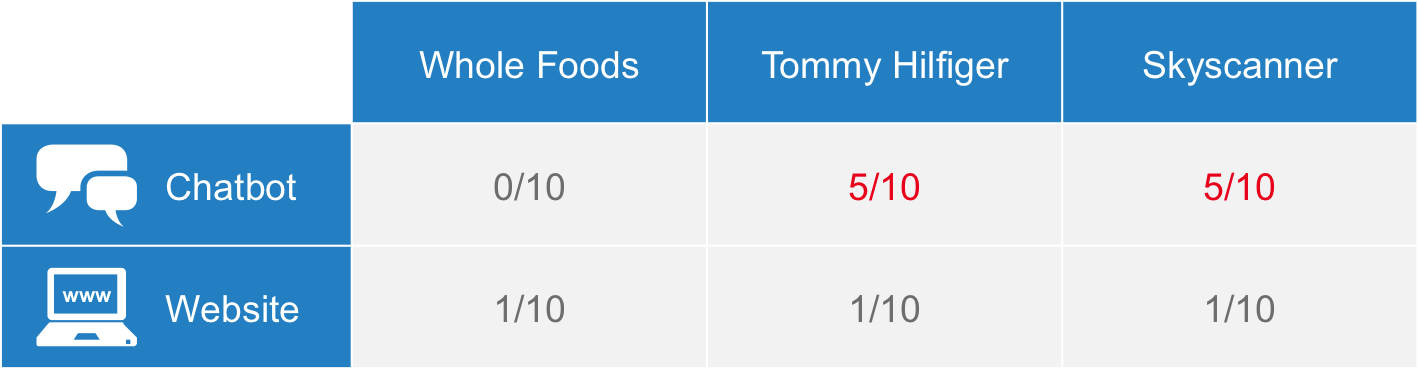 Seven out of ten participants abandoned one or two tasks with a chatbot while only three abandoned a task on a website. This is due to the fact that some tasks are longer to complete with a chatbot. Participants took an average of 3:04 minutes to complete a task with a chatbot or decide to give up and 1:39 minute to complete a task on a website. On average, they need 85% more time to complete a task when using a chatbot.
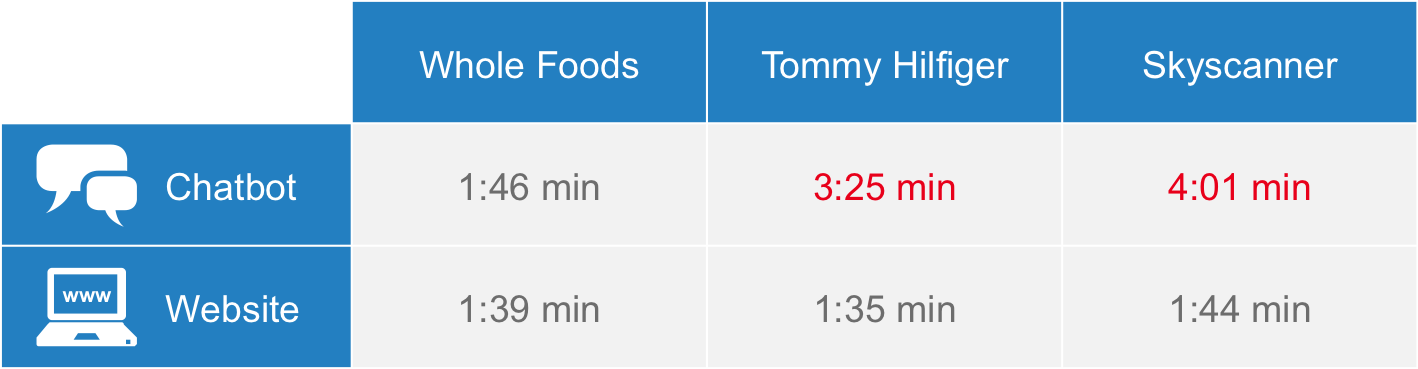 Whole Foods stands out once more. Participants take almost the same amount of time to complete a task using its chatbot and website. They take twice as much time with Tommy Hilfiger and Skyscanner’s chatbot than website because there are more steps to go through. Let’s have a look at Skyscanner’s case. To search for plane tickets on Skyscanner.ca, you need to give basic information (from, to, when and who), click “Search flights” and voila. You are done.
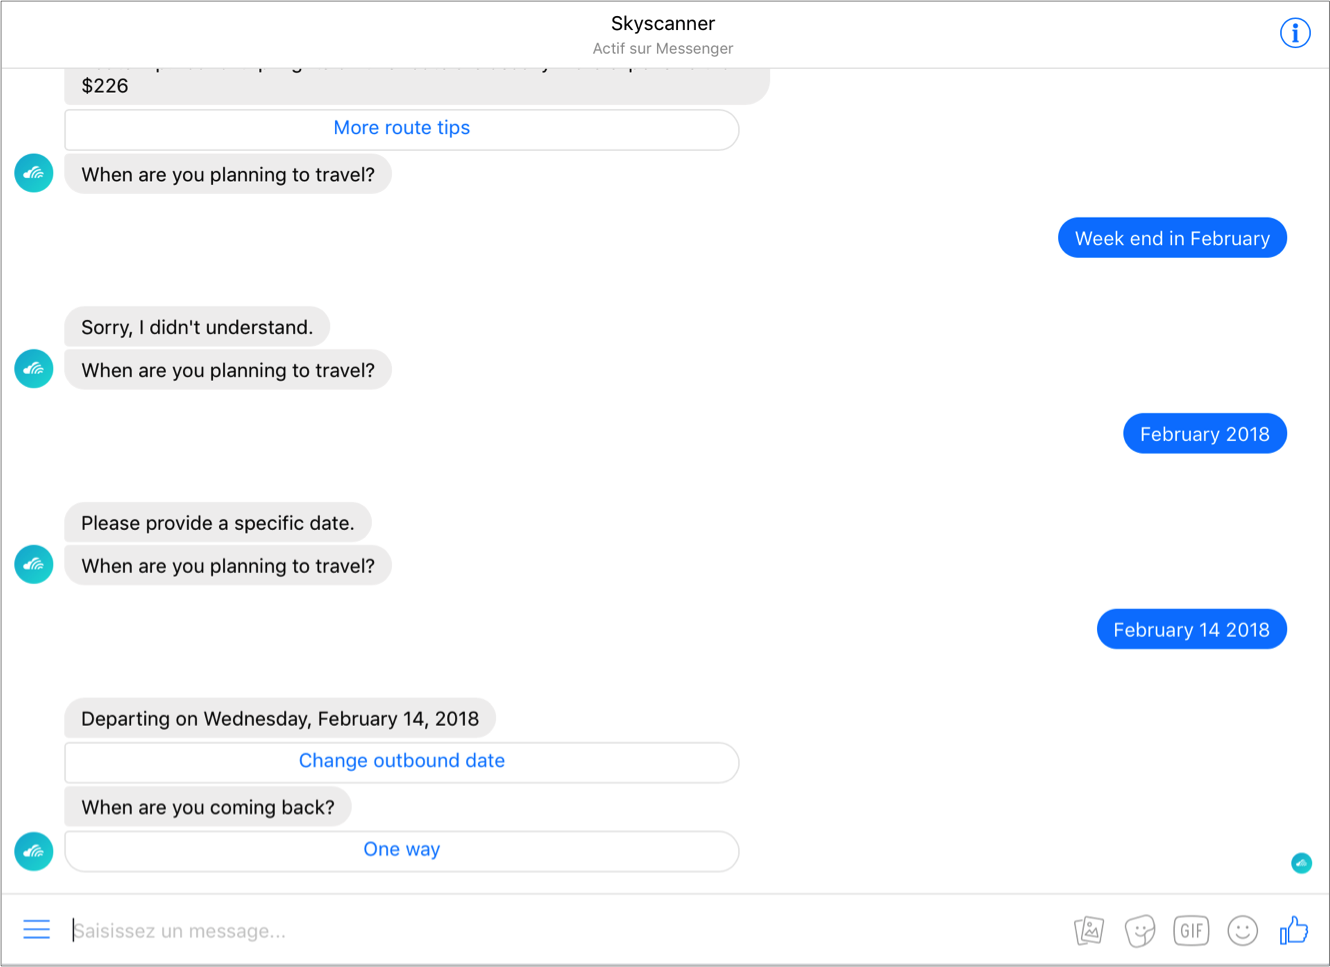
 It is not as quick with Skyscanner’s chatbot. You need to communicate each element one after the other to be understood. This makes the process much longer.
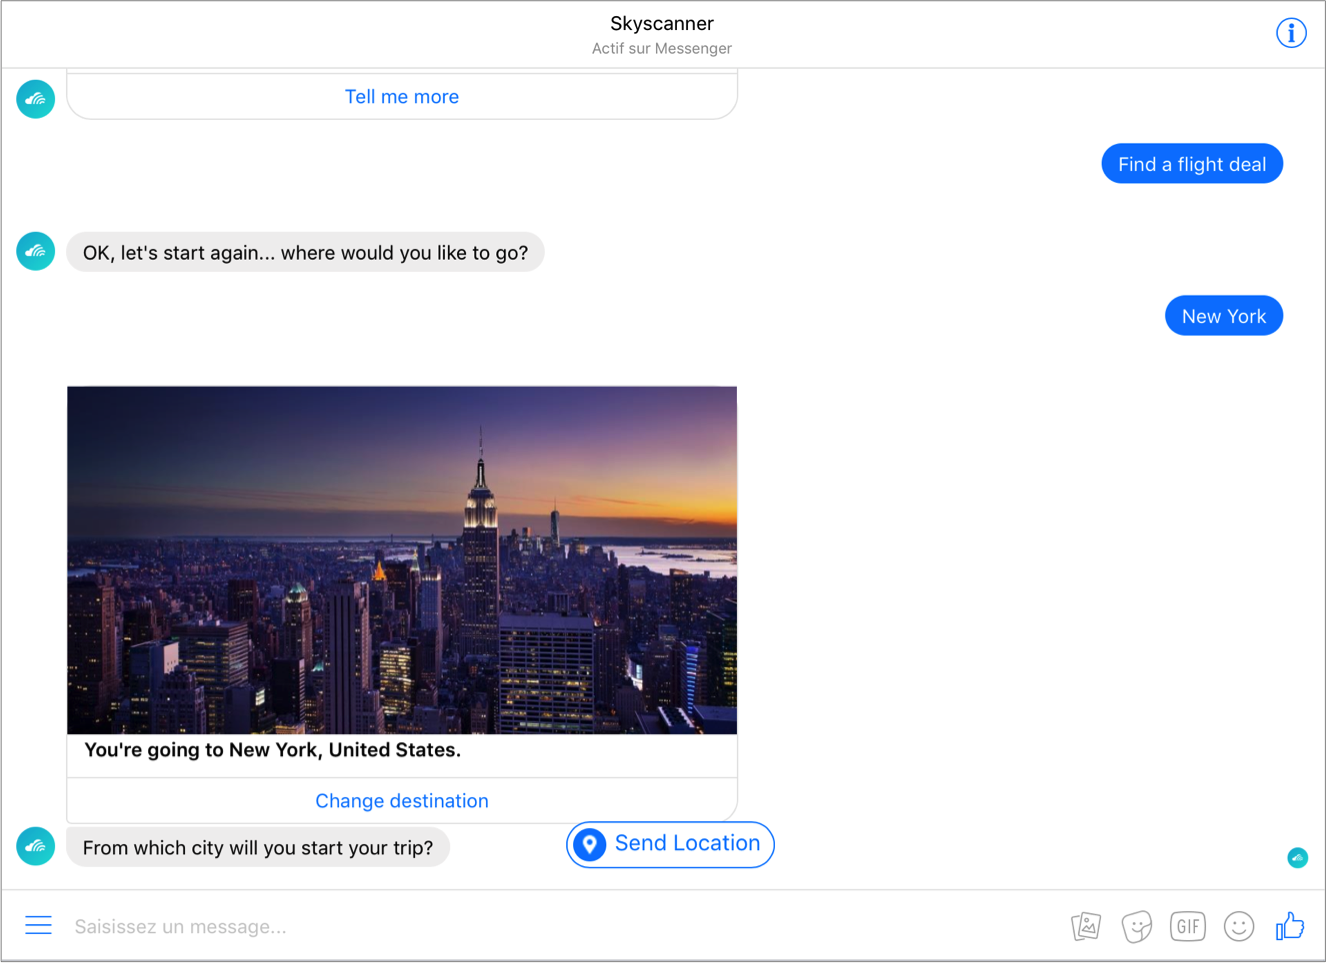
Besides additional steps, the fact that chatbots have limited understanding of human language annoyed participants. It even caused some of them to abandon tasks. They feel chatbots do not understand them and do not communicate clearly what information they want. For example, Skyscanner’s chatbot asks users when they want to travel but does not specify which date format it accepts. Such imprecision forced participants to repeatedly enter the same information before figuring out what was expected.
Chatbots Generate More Positive Emotions.
We analyzed participants’ facial expression with FaceReader, a facial expression analysis software. Specifically, we looked at the average positive or negative emotion intensity during a task. It is called emotional valence and varies from -1 to 1. A -1 valence indicates a 100% negative emotion, 1 a 100% positive emotion and 0, a neutral reaction. If you gave up on chatbots at this point, you will be surprised to find out they generated more positive emotions than websites. Participants’ average emotional valence is -0,26 with chatbots compared to -0,37 with websites. As for user experience, there is a statistically significant difference between chatbots and websites at a 95% confidence level. However, this time, chatbots did better than websites.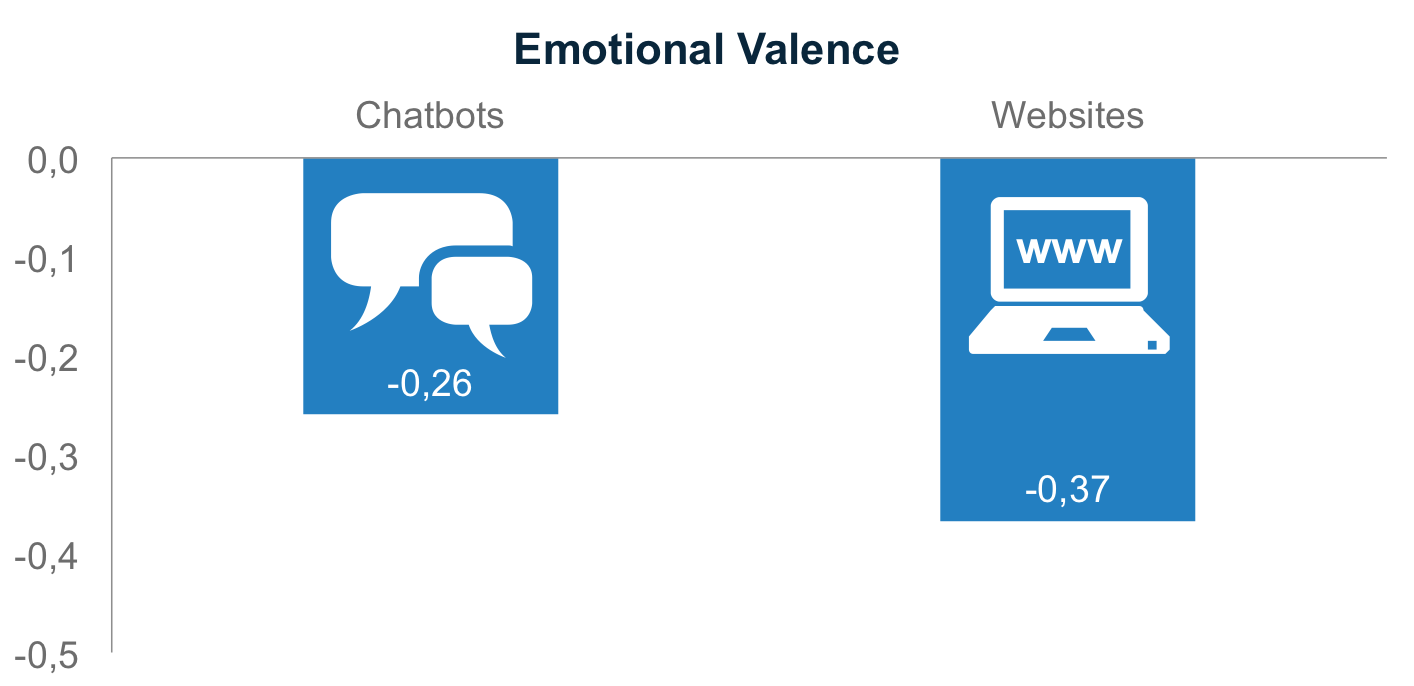 Average valence is negative in both websites and chatbots. This is normal considering online search is not particularly hedonic. In most utilitarian contexts, emotional valence is negative or very close to neutral. Our results show that participants expressed more positive emotions while using chatbots. Here, Whole Foods is no exception and results are similar for all three chatbots and websites.
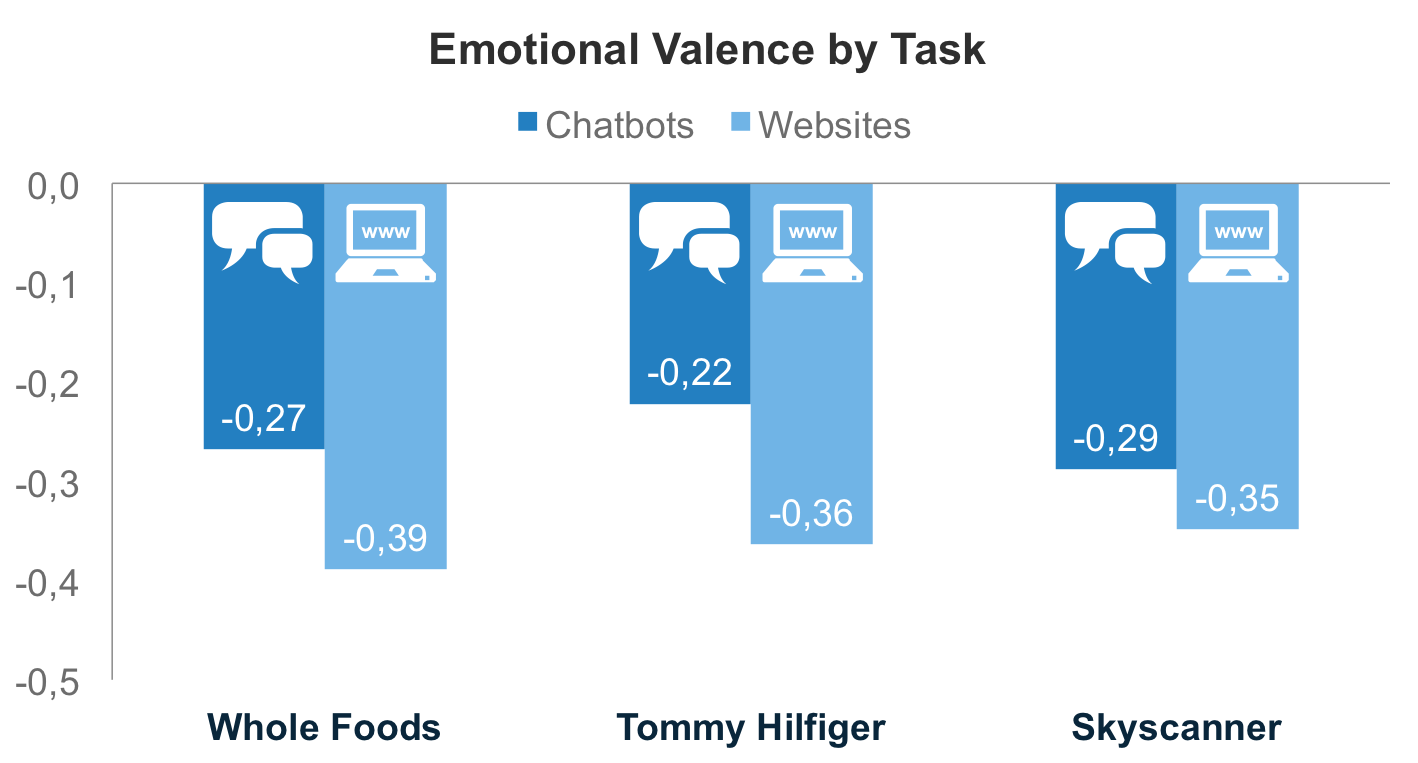 Surprised? We were. After all, websites did better than chatbots in terms of user experience and success rate. It makes sense. Talking to a “person”, whether robot or human, is generally more pleasant than using a website interface. It is one of chatbots’ strengths. Based on these results, we can presume the more humanlike a chatbot is, the more positive emotions it will generate. For example, Quebec’s pork producers’ virtual chef is quite different from the chatbots we tested. It has a name (Alex) and a face.
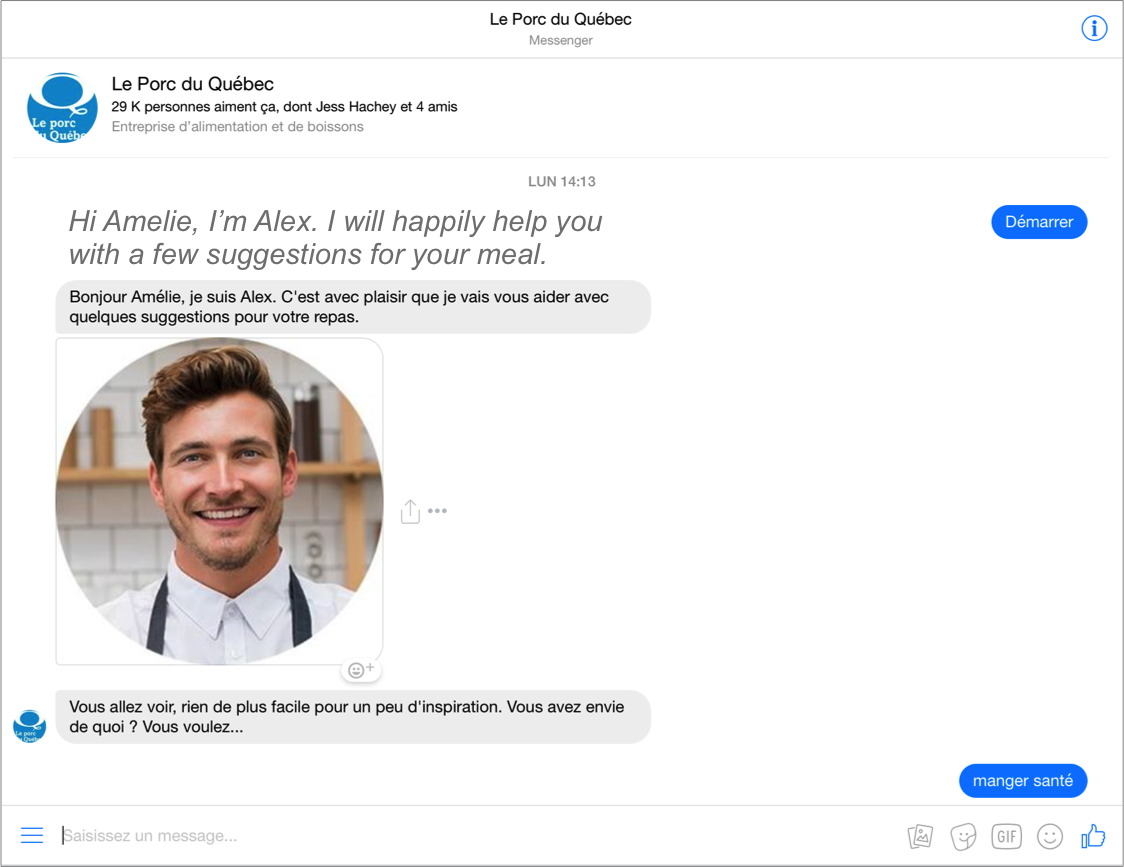 As a follow-up to this study, it would be interesting to compare emotions generated by chatbots like Alex to emotions generated by less “human” chatbots.
Conclusion: Chatbots Have Some Catching up to Do.
Getting a quick and precise answer is what participants like the most about using chatbots. However, they find them limited and are irritated by not being understood right away. Despite these shortcomings, they still believe they could use chatbots in the future. They assume chatbots will become more intelligent and reactive as technology improves. On a scale of 1 to 7 where 1 means “Not at all likely” and 7 “Very likely”, they rate their intention of using chatbots in the future at 3,7/7 on average.
While artificial intelligence is evolving, chatbots have potential to offer a pleasant and customized experience to Internet users. They can also generate positive emotions. Of course, there is still work to do before consumers widely adopt them. Chatbots need to become at least as intelligent as websites. Search engines are still the better option. Marketers should keep in mind that consumers refer to websites as the benchmark when it comes to online search. For example, by telling Alex (Quebec’s pork producers’ virtual chef) that I am a vegetarian, I expected it to react like a website. I expected it to say it can only provide pork recipes or that it does not have recipes for me.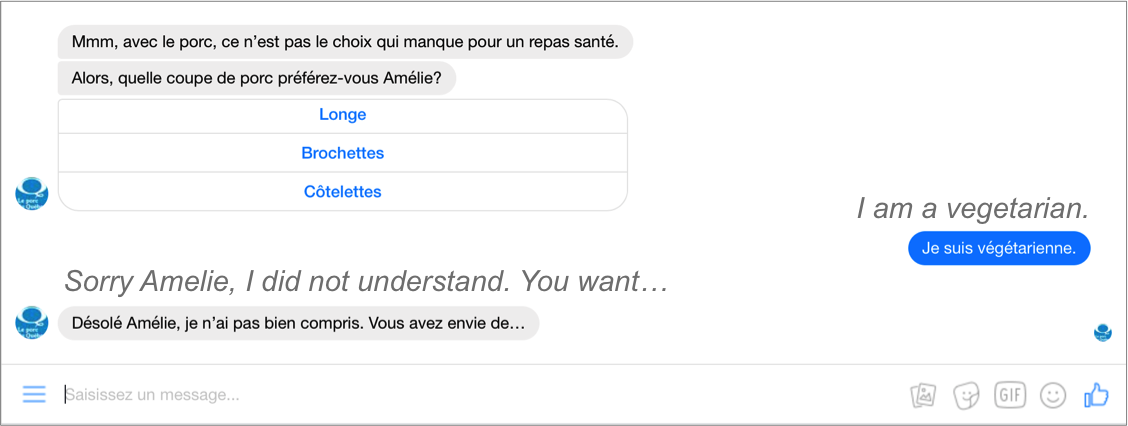 Unfortunately, it does not understand me. The website does. When I search for “vegetarian recipe” on Quebec’s pork site, the search engine tells me there is no results.
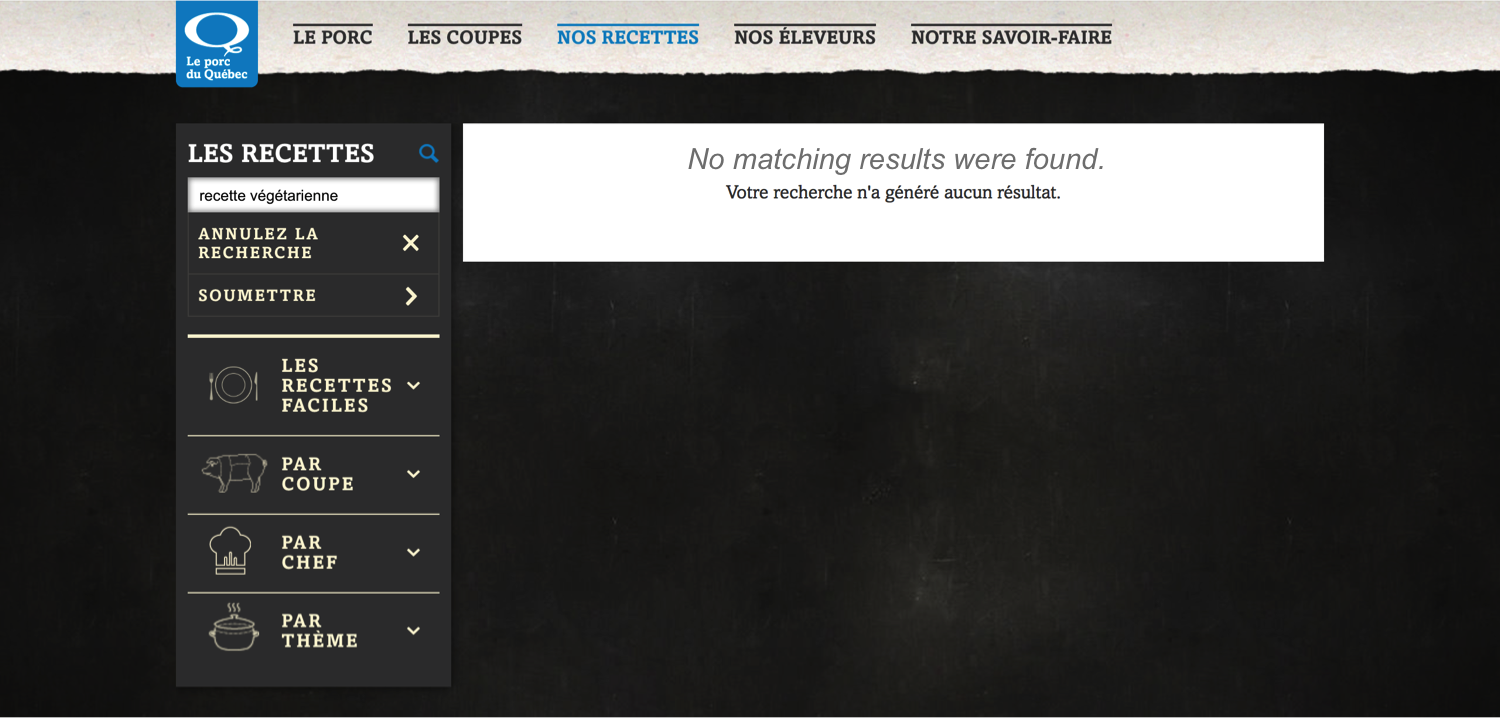 We should keep in mind that the average Internet user is used to websites and that chatbots are still a new concept. That being said, familiarity could partly explain why participants prefer the user experience on websites.
Chatbots are particular because they provide information in a Question-Answer format. Websites give information in a different manner. They provide a lot of information at the same time with a variety of tools to help users find what they need (e.g., menus, search engines, etc.). It seems like chatbots have even more room for improvement for precise and utilitarian search and could eventually outdo websites in that situation. This is what the high success rate for recipe search using Whole Foods’ chatbot and low success rates for more precise tasks tend to tell us.
Do you think chatbots will go out of style or eventually improve and replace websites?
***
Methodological Approach
Because we are committed to conducting research according to scientific principles, here are a few details about our methodological approach for this study. Do not hesitate to contact us if you want to discuss how we evaluate user experience.
Recruitment
We recruited ten university students through email and social media. We asked interested students to share their contact information for us to do a follow-up. We invited a total of four men and six women aged between 21 and 29 years old to participate in our study in Montreal. Participants were not related to the moderator and never met beforehand.
Usability Tests
Tests lasted about an hour each and took place from November 27th to 29th 2017. Participants did the following tasks without assistance like they would at home: Find…
- A salad recipe to serve as starter using Whole Foods’ chatbot;
- A salmon recipe to serve as main course using Whole Foods’ website;
- A new coat using Tommy Hilfiger’s chatbot;
- New black pants using Tommy Hilfiger’s website;
- A flight to New York City for a weekend in March 2018 using Skyscanner’s chatbot;
- A flight to Paris for a week in May 2018 using Skyscanner’s website.
We randomized task order from one participant to another to alternate brands (Whole Foods, Tommy Hilfiger and Skyscanner) and tools (chatbots and websites). For example, some participants began searching recipes with Whole Foods’ chatbot while others began searching pants on Tommy Hilfiger’s website.
Data Collection
We collected the following data to compare websites to chatbots for a total of 60 observations (10 participants x 6 tasks):
- Time required to complete each task or before abandonment;
- Abandonment rate for each task (abandonments / participants);
- Responses to a user experience evaluation questionnaire after each task;
- Participants’ facial expression during each task;
- Qualitative feedback from participants about chatbots after tasks.
For the user experience questionnaire, we adapted the USE questionnaire to evaluate usefulness, ease of use, ease of learning and satisfaction. Participants were asked to evaluate the extent to which they agreed or disagreed with eight statements. We used a 7-point Likert scale from 1 “Strongly Disagree” to 7 “Strongly Agree” to capture participants’ responses. We evaluated each dimension (e.g., usefulness) with two statements. For more information about the USE questionnaire, refer to: Lund, A. M. (2001). Measuring usability with the USE questionnaire, Usability Interface, 8(2), 3-6.
Facial Expression Analysis
We analyzed participants’ facial expressions at Tech3Lab at HEC Montréal. To learn more about FaceReader software and the theory behind facial expression analysis, see: “Les expressions du visage comme source d’information” (in French).
