What happens when we combine traditional research and new technology to measure advertising effectiveness? To put this to the test, we worked with Leger to evaluate video ads with actual consumers. Specifically, our study monitored respondents’ facial expressions while they viewed video ads. This was a logical next step to our previous study measuring emotional reaction to four Christmas ads in 2015.
Video ads from Toyota, RE/MAX, Kijiji, Banque nationale, St-Hubert, Proprio Direct, Desjardins, Honda, Nutrilait and Aldo were shown to a sample of 200 consumers recruited through the Legerweb panel. Ads were chosen to provide an overview of advertising effectiveness in multiple industries. Most are 15-second ads (or-30 second for Aldo), short enough to be shown before online content.
Results: Positive Rise and Final Punch
Ads from St-Hubert, Desjardins and Nutrilait are the only ones to generate a globally positive emotional reaction. Reaction to Toyota, Honda and RE/MAX ads was almost neutral while ads from Banque nationale, Proprio Direct, Aldo and Kijiji caused negative emotions. By taking a closer look at our three winning ads, you’ll notice they have common characteristics.
St-Hubert Takes it All.
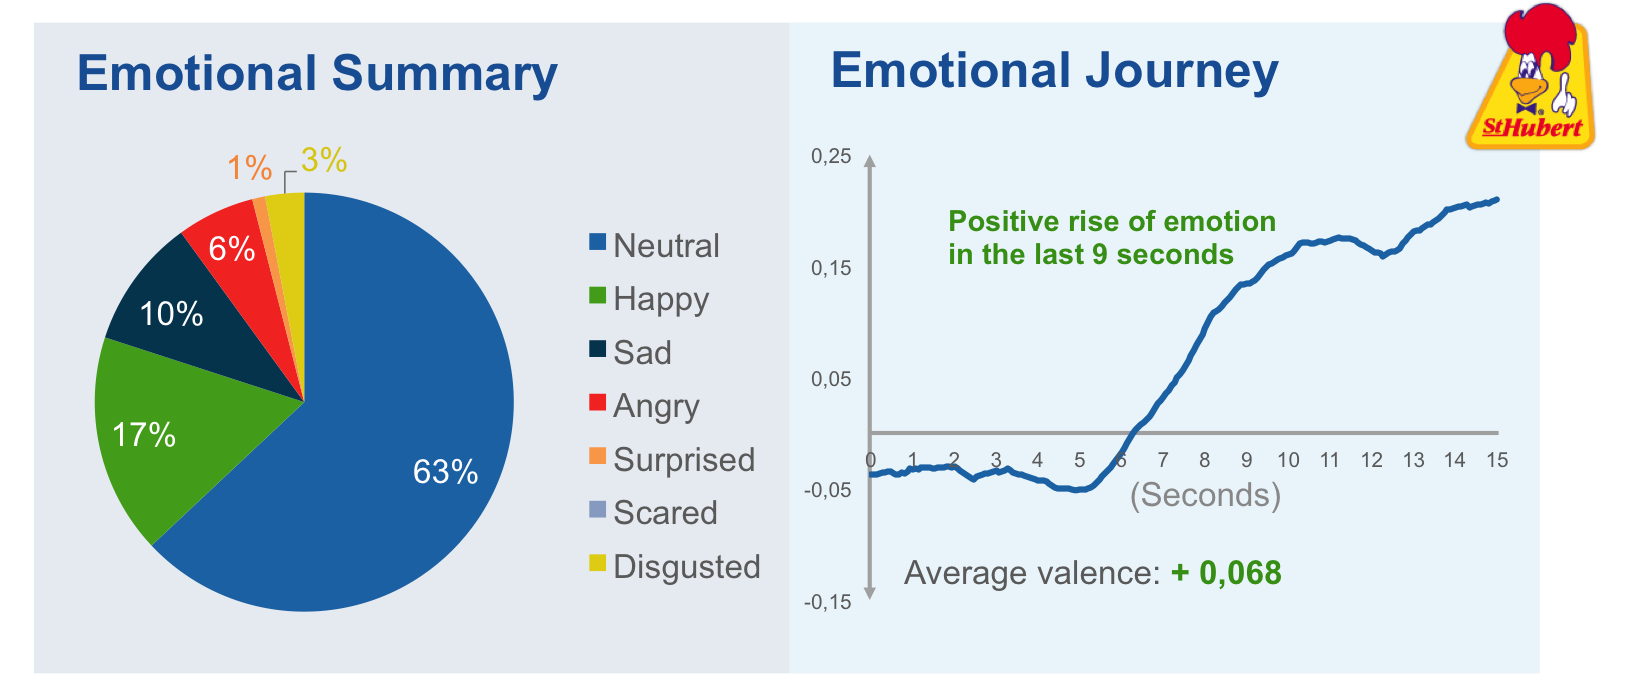
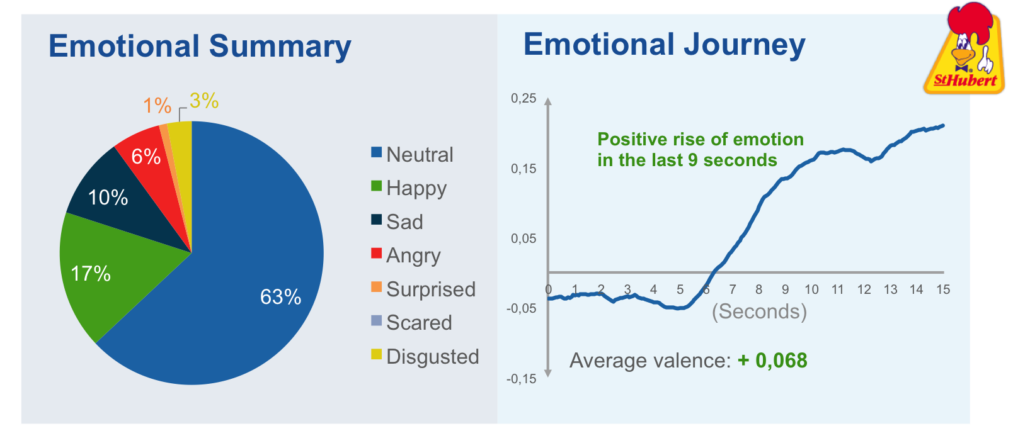
St-Hubert’s ad “Sugar Sammy aime la variété” (Sugar Sammy likes variety) generated the most positive emotional reaction and ranked first in our survey. Respondents liked this ad the most and thought it would be the most enjoyable pre-roll ad (imposed before viewing online content). It also had the most favorable impact on their attitude towards the brand and was the most likely to be shared on social media.
Emotional summaries show that St-Hubert’s ad generated the highest proportion of joy. However, emotional journey, which relates to the positive or negative emotional variation (valence between -1 and 1 where -1: 100% negative expression, 1: 100% positive expression and 0: neutral expression), remains the most powerful predictor of ad appreciation. We noticed a positive rise of the emotional state in the last nine seconds starting when Sugar Sammy’s mother enters the room yelling. Emotion reaches a positive peak in the last five seconds of the video when butter chicken is mentioned.
Nutrilait and Desjardins Follow Closely.
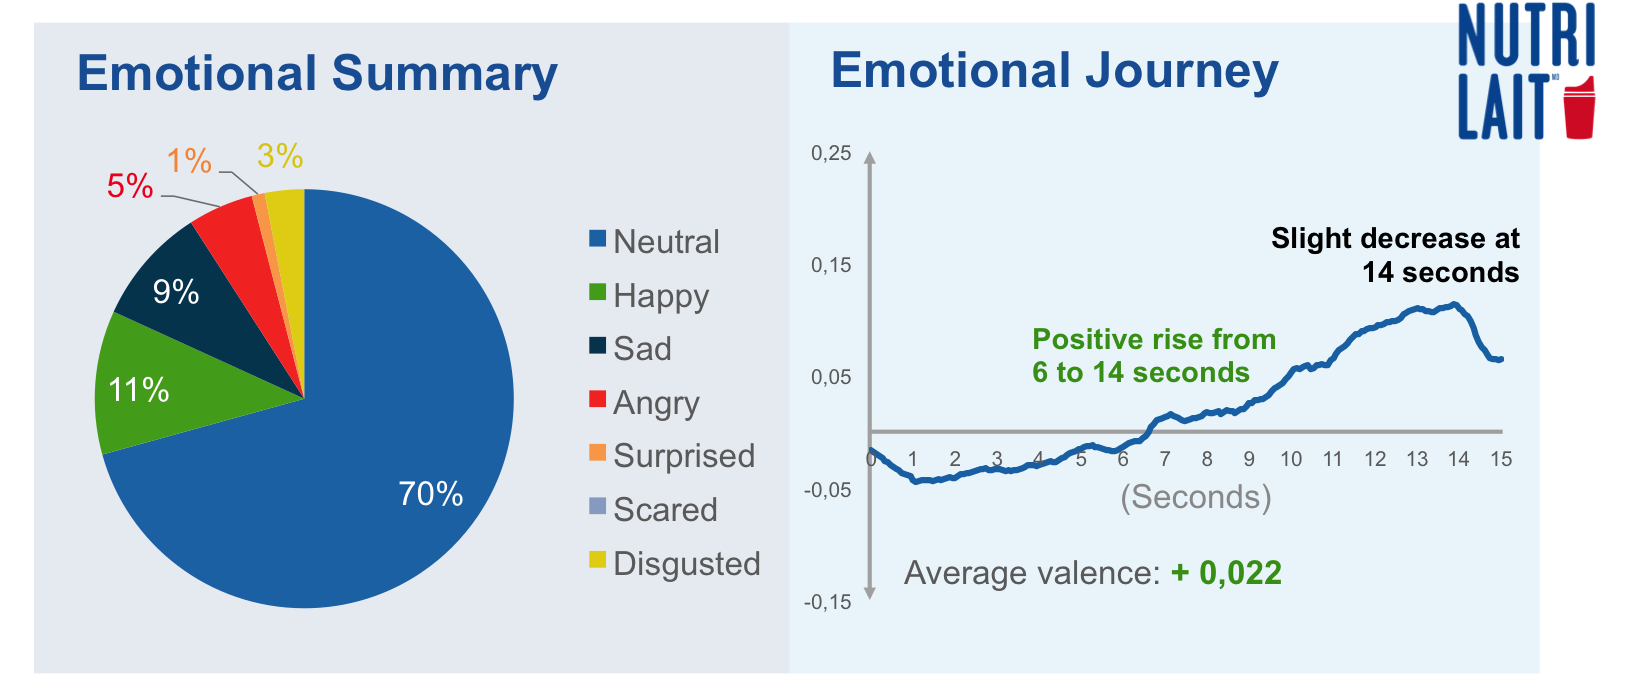
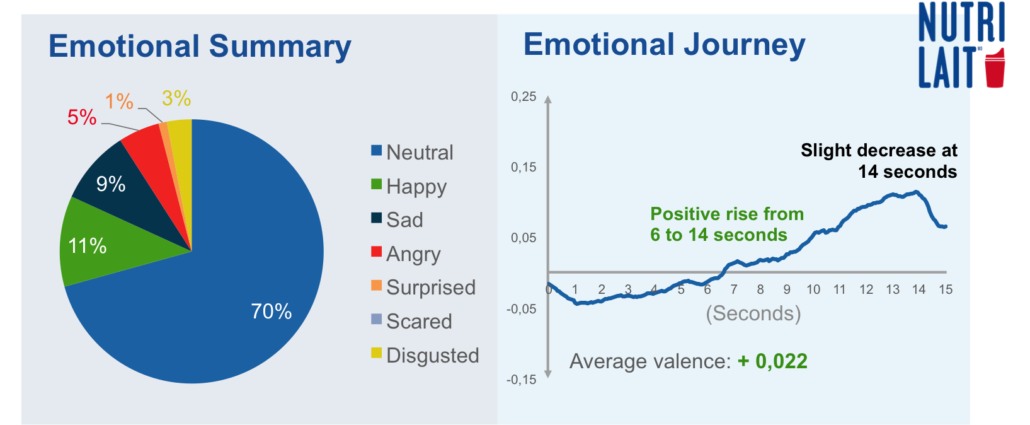
Nutrilait’s ad “Boire à meme la bouteille de lait” (Drinking from the milk container) follows St-Hubert closely. It ranked second for ad appreciation, attitude as a pre-roll ad (pleasant or unpleasant), impact on the opinion toward the brand (favorable or not) and intention to share on social media platforms.
As in St-Hubert’s ad, there is a positive rise of the emotional state between 6 and 14 seconds starting when the little girl screams. Here, emotion drops in the last second of the video when Nutrilait’s slogan is presented. Such was not the case for St-Hubert.
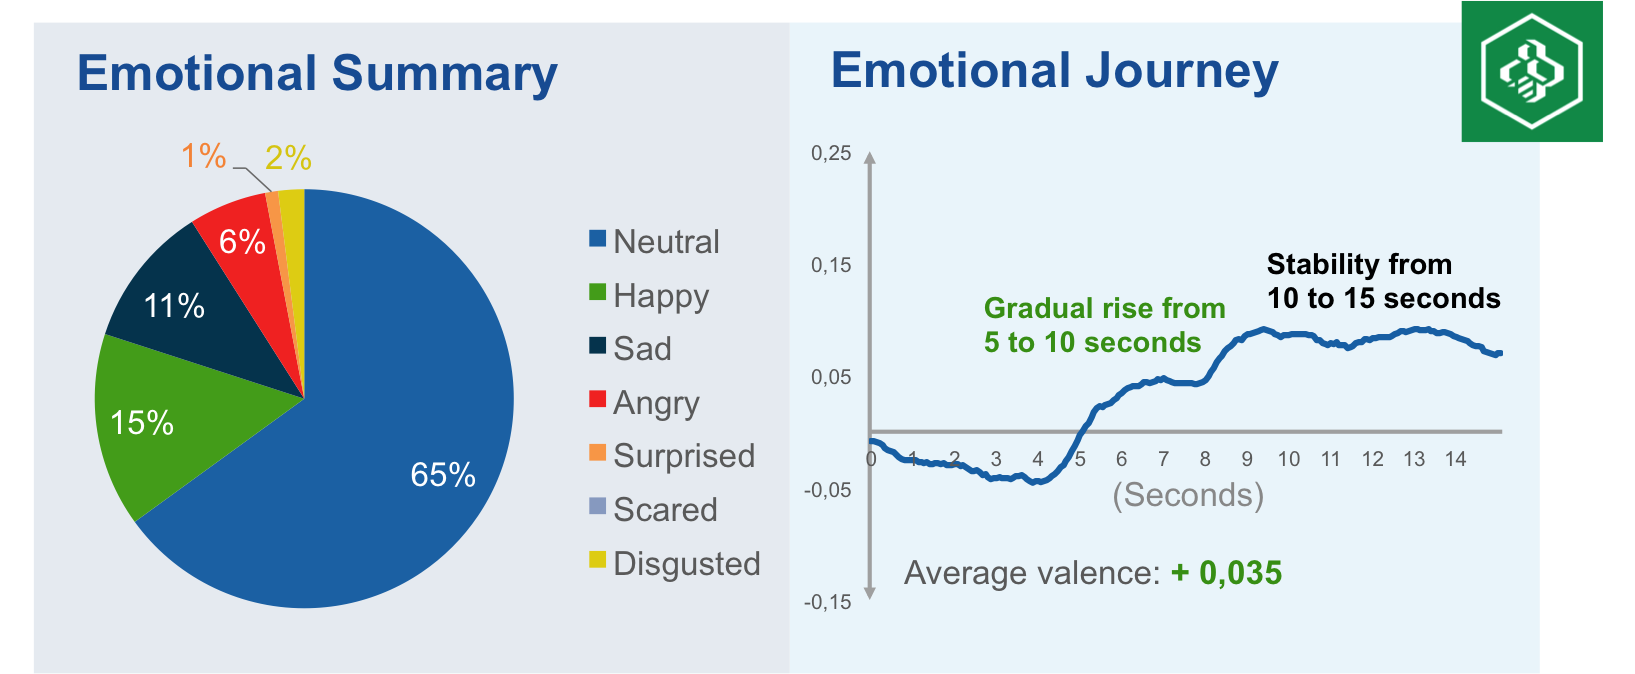
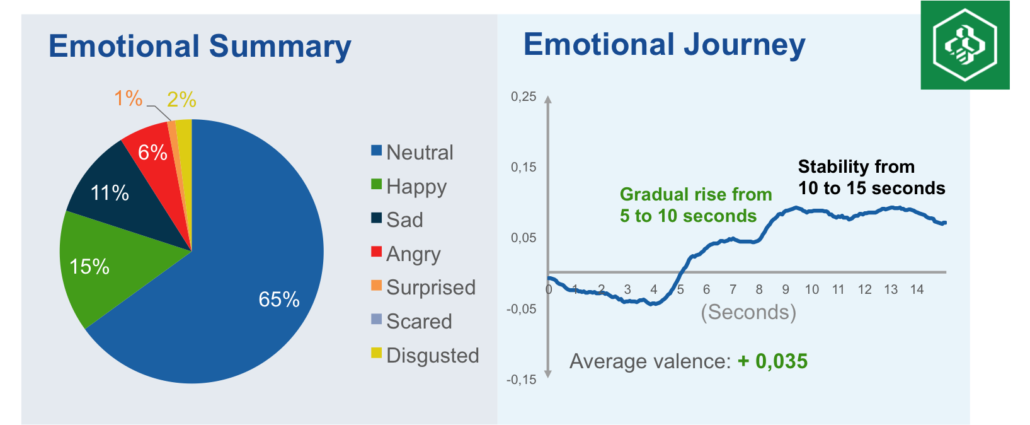
Globally, Desjardins’ ad “Offre verte – Maison” (Green Program – Home) generated a more positive emotional reaction than Nutrilait (average valence of 0,035 vs. 0,022), but did not perform as well in the survey. RE/MAX and Proprio Direct outranked it for impact on the opinion toward the brand and intention to share on social media. It ranked third behind St-Hubert and Nutrilait for appreciation and perception as a pre-roll ad.
Despite a proportion of joy similar to St-Hubert (15% vs. 17%), positive rise of emotional state is not as intense for Desjardins as it is for St-Hubert and Nutrilait. There is a light rise between 5 and 10 seconds before stabilization in the last five seconds. In fact, emotion starts rising when the green roof is mentioned and stabilizes after the black roof is mentioned to conclude the joke. The video ends with a stable and positive emotional state while Desjardins’s Green Program benefits are presented.
The 5 Last Seconds Have the Biggest Impact.
We were not surprised to find a positive correlation between average emotional valence and appreciation of a given ad. Emotional journey is the most revealing indicator of effectiveness. Our statistical analysis show that emotional valence during the last ad segment is almost perfectly correlated with the ad’s appreciation, intent to share on social media and perception as a pre-roll ad. I told you previously that our three winning ads had something in common. Well, they all show positive variation of the emotional state in the last segment of the ad.
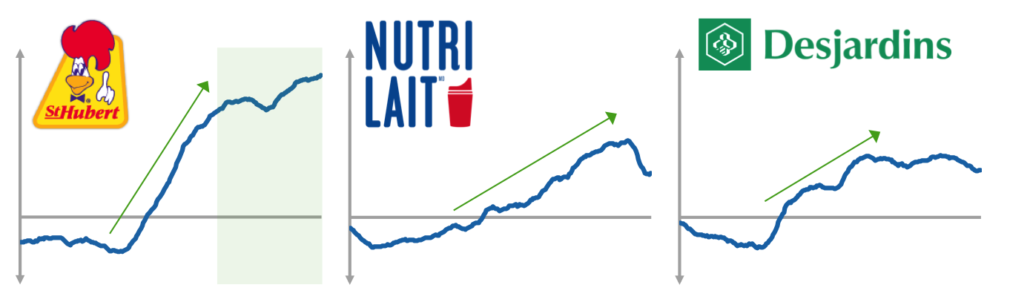
Ending on a positive AND rising emotional state is what distinguishes St-Hubert’s ad from the others. During the last five seconds, St-Hubert had an average valence of 0,181, compared to 0,087 for Nutrilait and 0,083 for Desjardins. We thus learned that the more positive the emotions, especially in the last few seconds of the ad, the more it may be appreciated, shared and accepted when shown before online content.
5 Best Practices for Advertisers
After analysis, we defined five best practices to create effective video ads.
- Go for a positive surge of emotion in the first part of the ad. The sooner the rise begins, the more effective the ad will tend to be. Such was the case for the three ads that performed best in our survey (St-Hubert, Nutrilait and Desjardins).
- End on a positive emotional peak. To fully benefit from the positive surge of emotion, end your ad on a positive emotional peak. Such was the case with St-Hubert, which was the best performing ad.
- Work on how the brand is presented at ad’s conclusion. The intensity of the emotion tends to drop in the last second of a video ad. To end on a positive emotional peak, work on how the brand and slogan are presented at the end.
- Collaborate with spokespersons to improve ads. How can you generate positive emotions during an ad? By using spokespersons to make it more interesting. We discussed St-Hubert and Sugar Sammy but Proprio Direct and RE/MAX also created positive emotional peaks with André Sauvé and Yves P. Pelletier.
- Integrate your brand in the story. To end on a positive peak, integrate the brand in the story you are telling. In Honda’s ad, the emotional state starts to rise late but the brand’s presentation generates a positive peak that lasts till the end. The brand’s name is shown with a punch in the story: “N’ouvrez pas votre capot à des inconnus” (Do not open your hood to strangers).
You would like to know more about this research or emotions measurement? Contact alexander.tellier@imarklab.com and we will be happy to provide the full report and discuss the results! To test and challenge our research methods, we studied various industries and came up with very interesting insights. Now, imagine all the possibilities if we apply this technology to your brand!
***
Research on Research
In 2017, digital ad spending share will surpass television for the first time in the United States (eMarketer, 2016). Video ads are more present than ever with the popularity of pre-roll advertising. You probably already experienced this form of advertising where you are “forced” to watch a short video ad (usually less than a minute) to access different forms of online content such as a YouTube video. The purpose of our research was to integrate facial analysis in measuring the appreciation of a video ad. Specifically, we wanted to measure emotions objectively. By combining Leger’s expertise in conducting surveys with imarklab’s experience with new technologies, we had everything in hand to measure advertising effectiveness.
An online survey was conducted by imarklab and Leger from April 4th to 11th 2016 with a sample of 200 consumers 18 years or older. The sample was split into two groups that each viewed five of the ten ads. Results were weighted based on demographic profile to allow comparison between the groups. During the viewing of each ad, respondents’ facial expressions were captured with a webcam to be analyzed by FaceReader software. After viewing, a series of questions were asked to measure the appreciation of the ad, impact on the opinion toward the brand, intention to share on social media platforms and perception as a pre-roll ad showed before accessing different forms of content on the Internet (e.g., YouTube video).
To learn more about FaceReader software and the theory behind facial expression analysis, see: “Les expressions du visage comme source d’information” (in French).